Advanced Class
GIC provides advanced classes for those of you who already know the basics of forex trading
Ichimoku Kinko Hyo: Definition and Best Setting Method
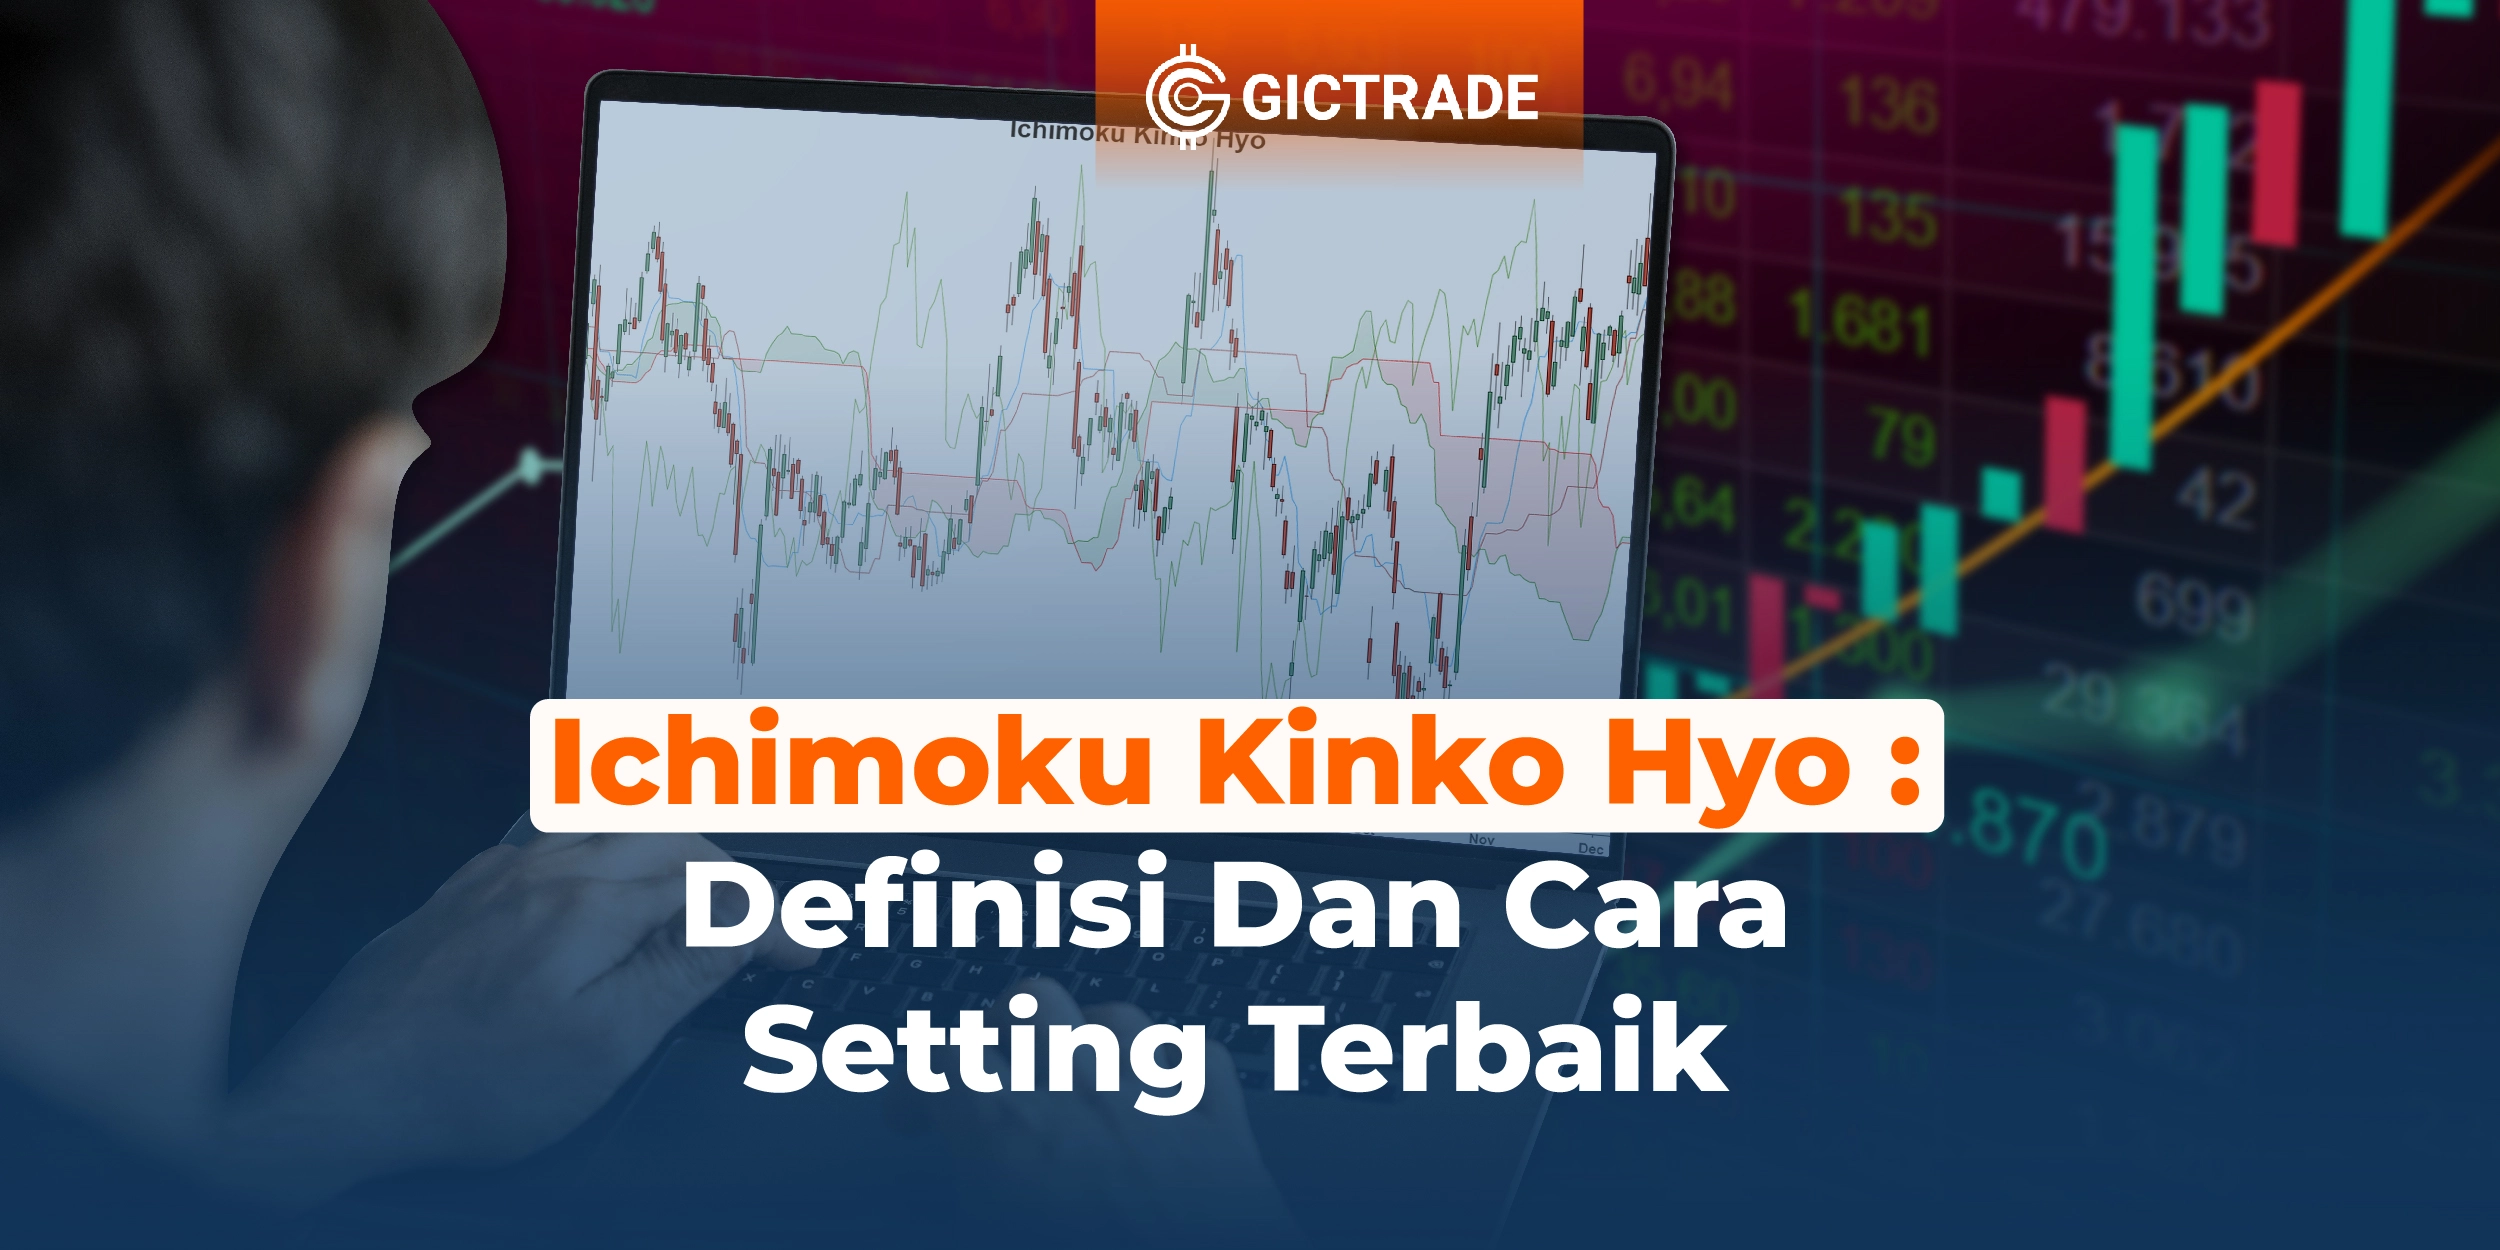
What is the Ichimoku Cloud Indicator? Ichimoku Kinko Hyo or can also be abbreviated as ichimoku is an indicator used for forex trading to measure momentum simultaneously with future support and res
Swing Trader: Definition and Commonly Used Strategies
What is Swing Trade? Swing trader is a term for people who run swing trading. The definition of swing trading itself is a strategy that focuses on reaping small profits on short-term trends by cuttin
How to Read Evening Star Candle Patterns for Forex Trading

What is Evening Star Candle Evening star candle is a three-star candlestick pattern that usually occurs at the top of the market and will be seen when the market starts to fall. This
Definition & How to Trade Using Naked Trading
Naked trading is generally popular and often referred to as price action. This trade is where traders analyze and predict the future of the market based on current price movements without the help of
9 Types of Investment Risks That Investors Should Know

So Here's How to Play Forex Trading to be Successful Understanding Investment Risk Investment Risk: Definition, Types, and How to Prevent It Example of investment risk, GIC Trade - For investo
Definition, Weaknesses, Strengths & Examples of Lorenz Curve Ques...

Before you learn more about the Lorenz curve example questions for additional knowledge, of course you must first know the basic understanding of the Lorenz curve. In this article, we will provide you
Get to Know the Bearish Star Doji Pattern & Its Benefits for Trad...

What is a Bearish Doji Star? Bullish Doji: Meaning, Types, and How to Read Candle Patterns Bearish doji star itself is the name used by traders for trading sessions that have almost equal open and c
Traders Must Know! The Best Forex Signal Indicators

Understanding Forex Signal Indicators In the world of forex trading, of course every trader certainly has their own method. That's not a big problem, as long as you, a trader who uses the best, most
Differences Between Supply and Demand Indicators in the Stock Wor...
Supply and Demand Indicators - When it comes to trading in the market, most traders certainly need indicators to help them identify trend imbalances in the financial market. Banks and other
HnS Pattern: Characteristics, Trading Methods, Advantages, and St...
HnS Pattern is a chart formation used in technical analysis to indicate a security's reversal in price direction. Learn more in the following article. Be sure to follow GIC's Instagram account to get
Learn About Reversal Patterns in Trading and Their Candlestick Pa...
This Reversal Pattern is a change in the price direction of an asset. Reversal can occur up or down. For more details about reversal patterns, you can follow the content of the article below. Table
Learn About Trading Range Theory, Stock Split, and Signaling Theo...
Trading Range Theory is determined by the high and low prices of securities, which fluctuate based on investors' desire to buy and sell. However, before learning trading range theory, you can learn ab
 Last:
Last: 

