 Last:
Last: 
Table of Contents
What is a Reversal Pattern?
A reversal is a change in the price direction of an asset. Reversals can occur up or down. Following an uptrend, a reversal will be to the downside. Following a downtrend, a reversal will occur up. Reversals are based on the overall price direction and are not usually based on one or two periods/bars on a chart. Certain indicators, such as moving averages, oscillators, or channels, can help isolate the trend and spot reversals. Reversals can be compared to breakouts.
Bullish Reversal: Characteristics, Conditions, Examples and Benefits
What is Reversal in Trading World?
Reversals are similar to Pullbacks. However, they usually refer to large price changes, which result in the development of a new trend. On the other hand, pullbacks describe smaller, temporary price movements that do not form a new trend. While Reversals continue to create a new uptrend or downtrend, pullbacks eventually end with the price returning to the direction of the original trend. Reversals usually occur quite quickly during intraday trading.
However, they can also occur over days, weeks, and even years. Traders use a variety of tools and techniques to identify and capitalize on price reversals. Moving averages and trendlines are just a few of the tools traders use to spot reversals.
However, they can also occur over days, weeks, and even years. Traders use a variety of tools and techniques to identify and capitalize on price reversals. Moving averages and trendlines are just a few of the tools traders use to spot reversals.
What is Reversal in Crypto?

A Pullback is defined as a sudden change in the direction of a cryptocurrency’s price. This type of price action can occur in either direction (up or down). During an uptrend, a Pullback will result in a downward price movement. During a downtrend, a Pullback will result in an upward price movement. A trend reversal marks the end of an existing trend and the beginning of a new one. Reversals can occur in any time frame and can mean the difference between a big win, breaking even, or a loss. Being able to effectively spot a Reversal is the quickest way to “jump in” on a new trade. An example of a popular Reversal is the Head and Shoulders.
The Head and Shoulders Reversal forms at the end of an uptrend. The highest peak is the Head. The top to the left of the Head is the Left Shoulder and to the right is the Right Shoulder. The line connecting the last two bottoms is known as the neckline, which acts as support. A break below the neckline forms the Head and Shoulders Reversal pattern which marks the end of an uptrend and the beginning of a downtrend. Another well-known trend reversal pattern is the Double Top or Double Bottom.
Like the Head and Shoulders Reversal pattern, it can occur in any market and time frame. The Double Top is a bearish Reversal signal after two tops have formed, with a modest decline in between. It is shaped like an “m” and is confirmed after price falls below support. This is equal to the low between the two previous tops. The double bottom forms a “w” pattern of two bottoms, where the second bottom is not lower than the first. The top found between the two bottoms acts as resistance and the Reversal is confirmed if this resistance is broken. This is a bullish Reversal pattern indicating the end of a downtrend and the beginning of an uptrend.
Reversal Pattern Candlestick Patterns
The purpose of the Reversal candlestick pattern is to signal that the short-term market direction, over the next few periods, is changing. This is in contrast to the continuation candlestick pattern which signals that the trend is likely to continue in the same direction. The “message” that technical analysts take from the Reversal pattern is that momentum has been exhausted and is now moving in the opposite direction. Here is for the reversal candlestick pattern:
Bullish Falling Wedge: How to Read, Characteristics, Types and Benefits
Bullish Reversal Pattern
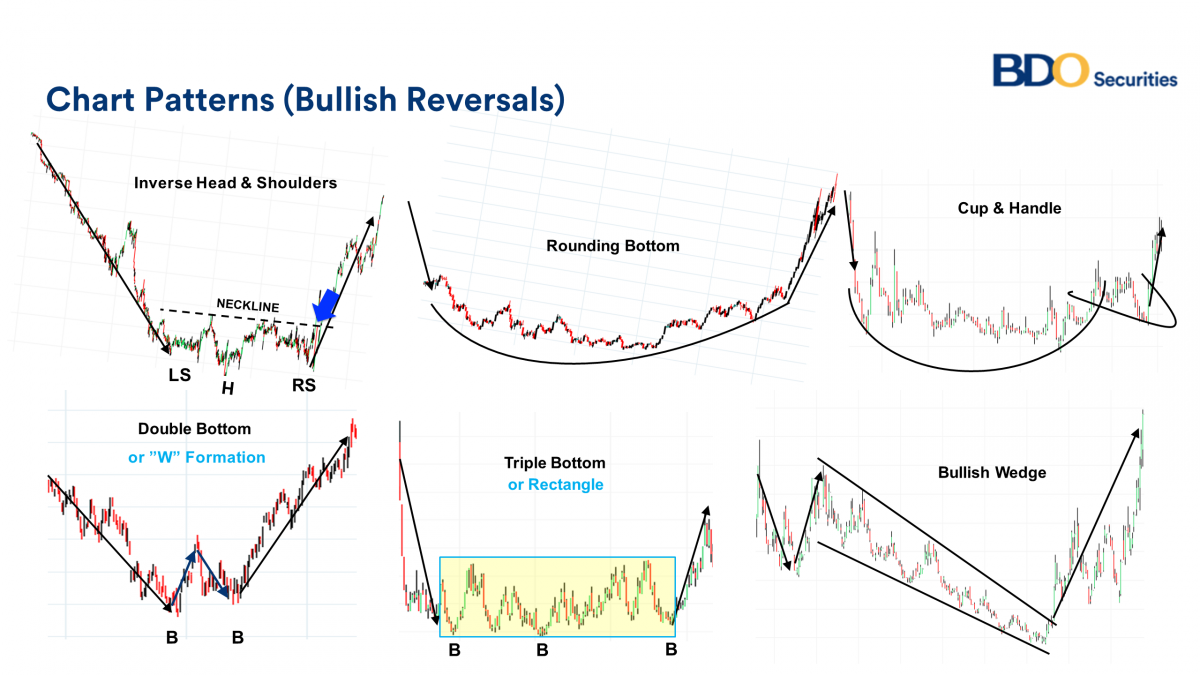
There are five main bullish reversal patterns seen above. You may notice that the bullish reversal patterns start with a bearish price movement that reverses to an uptrend in the stock price. This is because the bearish trend in the stock price reverses, leading to an uptrend in the stock.
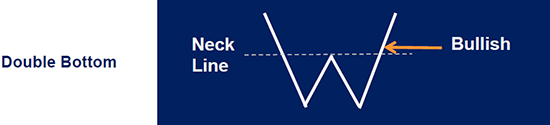
Double bottom (and triple bottom) is a pattern where the stock price will bottom two (or three) times before breaking out. Double and triple bottom patterns have a neckline that can be drawn from the highest point after the first bottom (and the second bottom for a triple bottom).
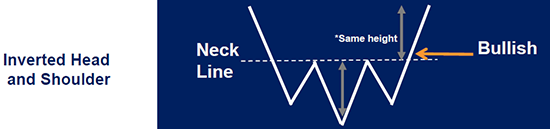
The inverted head and shoulders resembles an upside down head with two shoulders (see below for a more detailed picture of a head with two shoulders). The inverted head and shoulders pattern has the head as the lowest point and the two shoulders with a neckline. The height from the neckline to the head is used to create a bullish price target. The distance from the head to the neckline is used as an upward price target.
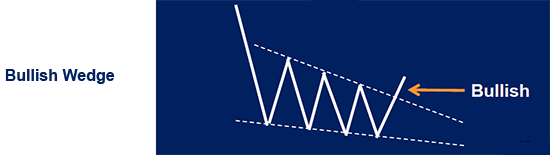
A falling wedge (also known as a bullish wedge) shows a pattern where the distance between the highs and lows decreases, leading to a wedge-like pattern. As the distance between the highs and lows narrows in the downward pattern, it leads to consolidation in price action. Eventually, if the stock breaks through the downtrend line (the line above on the chart above) the stock could break through, which is why this is a bullish Reversal (the stock turning from a bearish pattern to a bullish pattern).

Rounding Bottom is a rather rare pattern that begins with a bearish trending price. Price enters a prolonged consolidation phase (bottom) that eventually turns into a bullish trend. The Rounding Bottom consolidation phase can last for weeks or months before the bullish trend begins.
Bearish Reversal Pattern
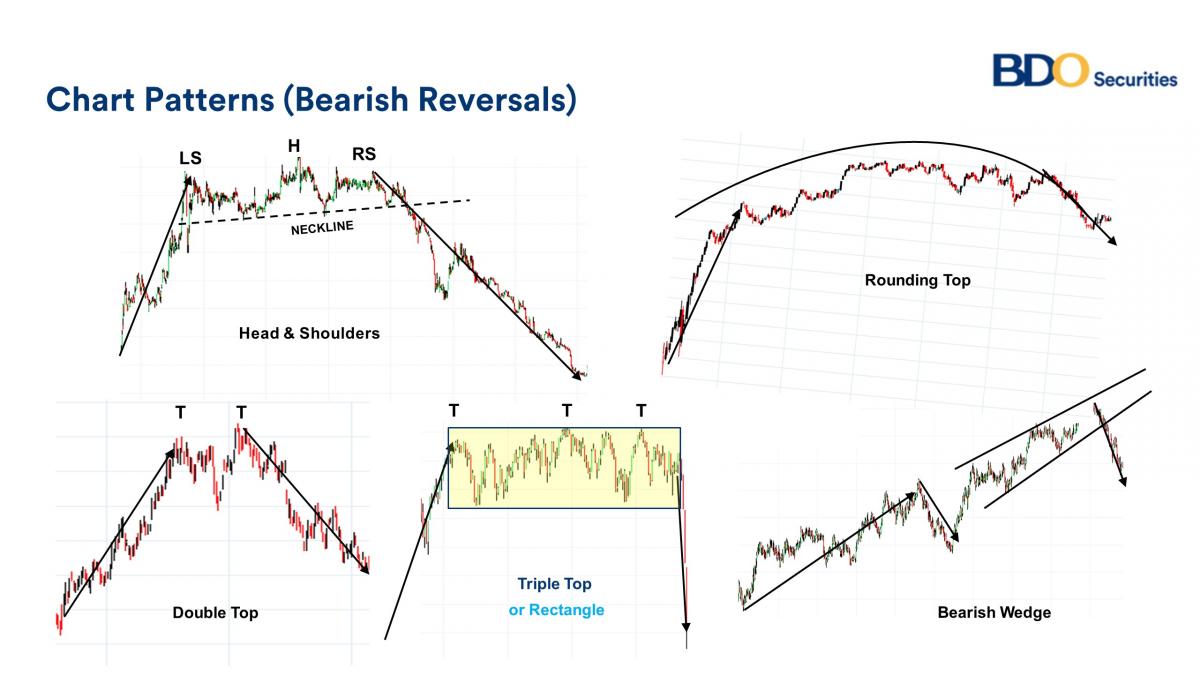
Similar to bullish reversals, there are five main bearish reversal patterns seen above. Bearish reversals begin with a bullish price movement reversing into a bearish stock price movement. This is because the bullish trend in the stock reverses direction, leading to a bearish trend in the stock.

Double tops (and triple tops) are patterns where a stock price will reach its highest level two (or three) times before breaking down. Double and triple top patterns have a neckline that can be drawn from the lowest point after the first top (and the second top for a triple top).
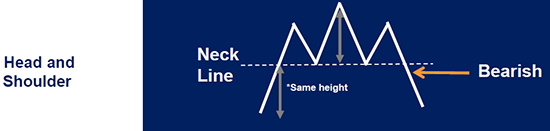
The Head and Shoulders pattern resembles a head (top) with two shoulders. The head is the highest point with the bottom of both shoulders being the neckline. The height from the neckline to the head is used to create a bearish price target. The distance from the head to the neckline is used as a bearish price target.
also read :
also read :
|
Characteristics and How to Trade the Inverted Head and Shoulder Pattern |
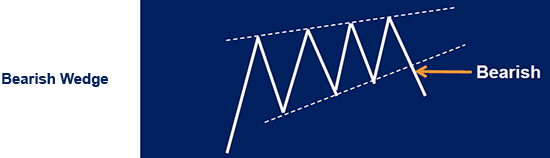
A rising wedge (also known as a bearish wedge) shows a pattern where the distance between the highs and lows decreases in an upward pattern, leading to a wedge-like pattern. As the distance between the highs and lows becomes tighter, this leads to price consolidation. Eventually, if the stock breaks through the downtrend line (the line at the bottom on the chart above) the stock can break down, which is why this is a bullish reversal (the stock turning from a bullish pattern to a bearish pattern).

Rounding top is a fairly rare pattern that starts with an uptrend in price. Price enters a prolonged consolidation phase (top) that eventually turns into a bearish trend. The rounding bottom consolidation phase can last for weeks or months before a bullish trend begins. After learning about reversal is a change in the price direction of an asset, you can also learn other patterns such as continuation patterns through the GIC Journal. This reversal pattern can help you in trading when you find a pattern on the chart. You can register at GIC if you are a beginner in trading. Because GIC also provides various kinds of learning through the GIC Academy.
Maximize Forex Trading Profits, Download the App Now!

Maximize Forex Trading Profits, Download the App Now!


