Last:
Last: 

If we do indeed ‘slide’ higher before any serious event risk becomes apparent, the period of controlled surge may be coming to an end. According to DailyFX, they have observed that there has been some serious knocking from the likes of the Nasdaq 100 amidst the slow release of FAANG earnings. Following Google’s earnings miss after the market closed on Tuesday, Nasdaq futures and QQQ fell significantly into Wednesday’s open. The -2.3 percent gap lower coincided with the end of the day’s losses after the tech-heavy index failed to ‘close the window’ (technician speak for closing the entire opening gap). The intraday bearish reversal produced the largest ‘upside wick’ since March 8. Notably, the after-hours reaction to Meta (formerly Facebook) was an eventual -20 percent after-hours decline that seemed to spur the relatively tepid reaction. Could the market be focused on upcoming Apple and Amazon earnings reports or key macro updates ahead? Nasdaq Futures Chart with Volume Overlay with Google and Meta (15 Minutes)
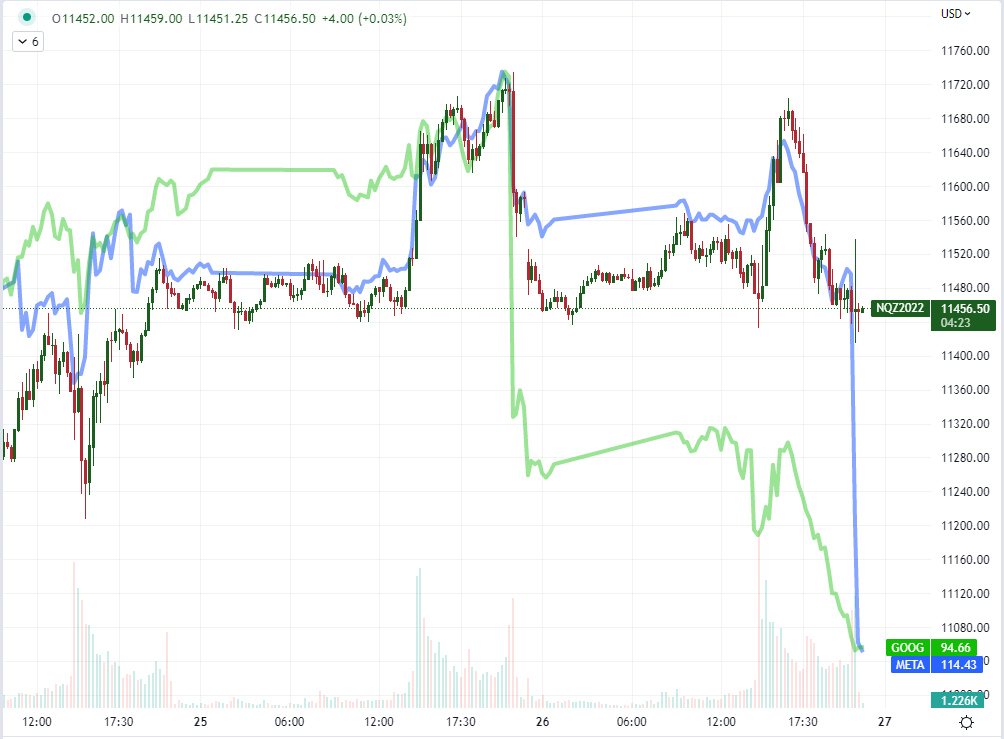
Chart Created on Tradingview Platform To control for some of the bias in anticipation, it is important to look at the performance comparison between the Nasdaq 100 and the Dow Jones Industrial Average. Both are major equity indices with all the ‘risk on’ implications with the added benefit of balancing the US focus. However, the NDX is more reflective of the ‘growth’ measure relative to the Dow’s ‘value’ label. It is worth mentioning that the NDX-Dow ratio peaked last December at around the same level as the Dot-Com peak in March 2000. That said, the ratio extended its decline throughout this past session to push to its lowest level since April 2020. Nasdaq 100 to Dow Average Ratio Chart with 20 and 200 Day SMAs and Gaps (Daily)
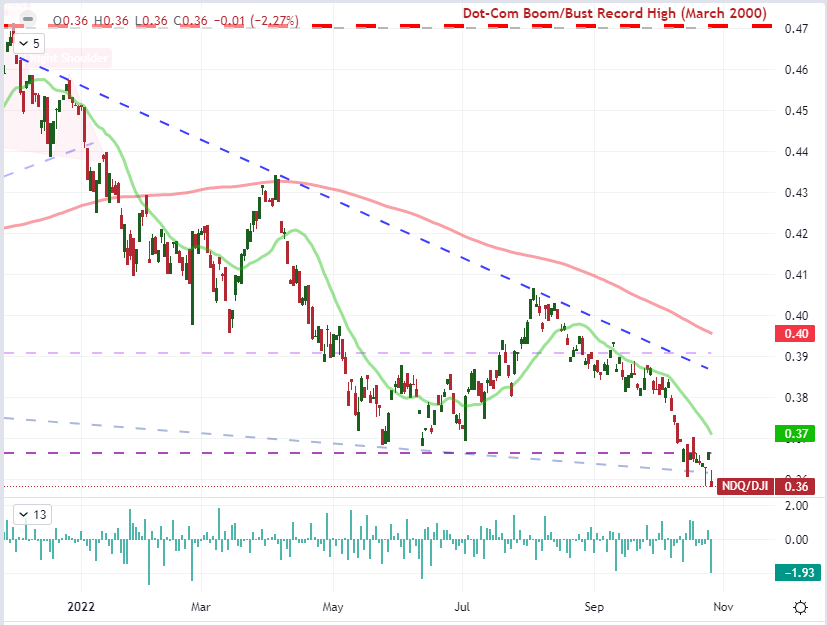
Chart Created on Tradingview Platform There is a big influence on the performance of the world’s largest economy in dictating the world’s valuation. That said, data and forecasts are not too late. The country’s housing sector was described as being in a ‘recession’ by the NAHB, the Conference Board’s leading index has been tracking a long string of consecutive declines. Last week’s NABE CEO survey reported two-thirds of respondents believe the country is about to enter (or is already in) a recession and only this past session did the US 10-year/3-month Treasury yield curve (economists’ preferred barometer) invert to warn of a ‘recession’. We may have a very attentive crowd as to whether third-quarter US GDP meets, beats or misses the economists’ consensus of 2.4 percent growth.
Nasdaq 100, Dow, Dollar, USDJPY, GDP, and EURUSD Talking Points:
- Market Perspective : USDJPY Bearish Below 146; EURUSD Bullish Above 1.0000; Gold Bearish Below 1.680
- While Facebook will post similarly disappointing earnings results as Google, the two companies will have very different impacts on the Nasdaq – but neither can compete with Apple.
- Event risk will increase higher over the next 48 hours with the ECB interest rate decision, US 3Q GDP, Apple and Amazon earnings, and more