 Last:
Last: 
What is the Richmond Manufacturing Index?
The Richmond Manufacturing Index is a widely followed monthly economic indicator in the region that includes the Mid-Atlantic states. The survey focuses on manufacturing activity in the region and measures sentiment and expectations among executives in the private sector. The types of manufacturing range from food and textiles to fabricated metal products and machinery. This survey is officially known as the Fifth District Manufacturing Activity Survey, referring to the area overseen by the Federal Reserve Bank of Richmond—one of the 12 Reserve Banks under the Federal Reserve. The Fifth Federal Reserve District includes Washington D.C., Maryland, North Carolina, South Carolina, Virginia, and most of West Virginia. The survey is also referred to as the Richmond Fed Survey. In the 1980s, the Richmond Fed was tasked with developing a survey in its region because there was no comparable regional survey to the national manufacturing survey, known as the Purchasing Managers’ Index, which was compiled by the Institute for Supply Management (formerly known as the National Association of Purchasing Management).Understand the Richmond Manufacturing Index
There is only one Federal Reserve, but there are 12 Federal Reserve Districts. The U.S. is too large, so it seems that a layer of bureaucracy is the way to go. In any case, the Richmond Manufacturing Index covers manufacturing data from the Fifth Federal Reserve District. It includes West Virginia, Maryland, Virginia, North Carolina, and South Carolina, along with the entire area around Washington D.C. The Federal Reserve Bank of Richmond conducts the survey to gather this data (and has been doing so since 1993). What type of manufacturing data? The basics: order and shipment volumes, employment... things like that. It is a diffusion index, meaning the variables are expressed as the percentage change between the most recent report and the current reporting period. For example, shipments are down by 5%, and employment is down by 6%. Traders may check the Richmond Manufacturing Index to get a sneak peek into the manufacturing sector before the Institute for Supply Management releases their manufacturing report, which comes out right after the Richmond Manufacturing Index. That, along with other indices, is often analyzed for signs of an upcoming downturn or rising inflation.Who Compiles the Richmond Manufacturing Index?
The Fed Richmond first released its manufacturing survey in 1986, and it was conducted every six weeks. It moved to a monthly format in 1993, and due to the survey's popularity in the manufacturing sector, the bank expanded to include the services sector. The survey is known as the Fifth District Services Sector Activity Survey. According to the bank, the manufacturing survey is sent to executives in manufacturing companies within the bank's district two business days after the results of the previous month are published, and data collection ends three business days before the results are published. Respondents are provided with a series of questions to compare business conditions from the last month to the previous one. The results are then compiled as a diffusion index, which measures the spread of changes—this is done in the same way as the Purchasing Managers' Index calculation. The manufacturing survey covers various aspects of business, such as shipments, new orders, order backlogs, capacity utilization (equipment usage), supplier delivery times, number of employees, average workweek, wages, finished goods inventories, and capital expenditures. Common questions include whether local business conditions have improved, worsened, or remained the same, and whether these conditions are expected to change in the next six months. Investors and analysts focus on the key numbers of the Fed Richmond composite manufacturing index. A number greater than zero indicates expansion in the manufacturing sector, while a number less than zero indicates contraction.

What is the Formula for the Richmond Manufacturing Index?
The Fed Richmond uses a basic formula for the diffusion index in calculating the manufacturing index and subindices. ![Composite Manufacturing Index = [100*(I − D)]/(I + N + D). I = number of respondents reporting increases; N = number of respondents reporting no change; D = number of respondents reporting decreases](https://www.thestreet.com/.image/t_share/MTkwNDQwMTYwNjc0OTgxNzg2/2.png) Composite Manufacturing Index = [100*(I D)]/(I + N + D). I = number of respondents reporting an increase; N = number of respondents reporting no change; D = number of respondents reporting a decrease In 2021, the Richmond Fed business survey covered 198 firms in the manufacturing sector and 418 in the service sector.
Composite Manufacturing Index = [100*(I D)]/(I + N + D). I = number of respondents reporting an increase; N = number of respondents reporting no change; D = number of respondents reporting a decrease In 2021, the Richmond Fed business survey covered 198 firms in the manufacturing sector and 418 in the service sector.
Survei Indeks Manufaktur Richmond?
Since November 1993, the Federal Reserve Bank of Richmond has conducted the monthly Manufacturing Activity Survey, which is electronically sent to selected manufacturing companies to participate based on their business type, location, and company size. Respondents are asked to report on their business activities, including shipments, new orders, backlogs, inventories, wages, and capital expenditures, from the previous month. Respondents are also asked to provide their business expectations for the next six months. A separate survey for service sector companies asks questions about revenue, demand, number of employees, average workweek, wages, and capital expenditures. For retailers, the survey includes questions about current inventory activity, major ticket sales, and customer traffic. Respondents are meant to report how business activity is proceeding during a specific period—whether activity is increasing, decreasing, or remaining unchanged. These responses are then converted into a diffusion index, recording the percentage decrease and the percentage increase. The report covers business activity from Maryland, North Carolina, District of Columbia, Virginia, most of West Virginia, and South Carolina. The results of each survey are released on the fourth Tuesday of every month.Example of the Richmond Manufacturing Index
This survey is closely monitored because, unlike other major economic indicators supported by data on prices and units, it relies on responses from executives about their views on business conditions. The survey is often seen as a reliable economic predictor. And although it covers a specific region, it often represents manufacturing activity across the U.S. Subindices such as wages may indicate whether inflationary pressures are increasing or whether companies are holding back on spending amid concerns about the economy slipping into recession. Below is a chart of the Richmond Fed manufacturing composite index over a 10-year period, from mid-2013 to mid-2022.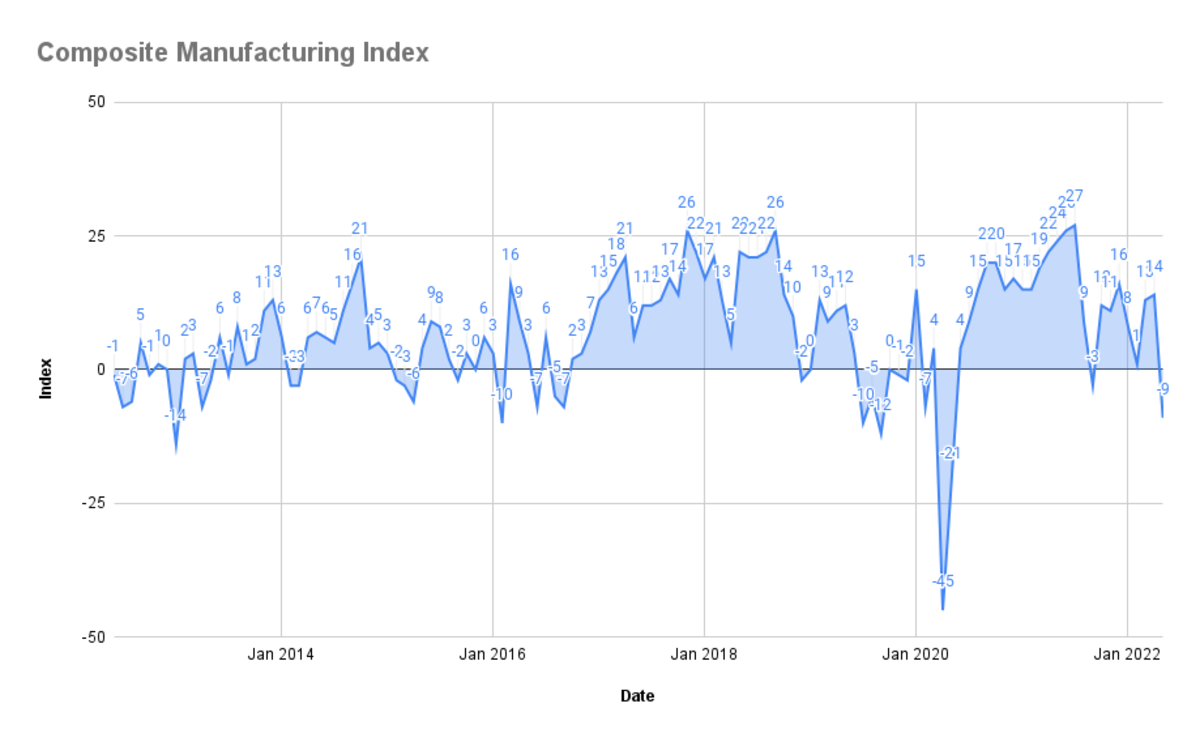
Deep troughs in the composite manufacturing index chart may indicate contraction in the economy. Data from the Federal Reserve Bank of Richmond via Google Sheets shows that the sharp decline in the index coincided with the economy contracting around the early COVID-19 pandemic in early 2020. However, manufacturing quickly rebounded in the following months.
When is the Richmond Manufacturing Index released?
The survey is released at 10 a.m. ET, on the fourth Tuesday of each month.Upcoming Release Dates in 2022
| Reporting Month | Release Date |
| August | 23 August |
| September | 27 September |
| October | 25 October |
| November | 22 November |
| December | 28 December |
How do the stock and bond markets react to the Richmond Manufacturing Index?
Financial markets generally react positively to positive results from the Richmond Manufacturing Index and negatively to poor figures. Investors and analysts view the manufacturing survey as a leading indicator of the economy, and they also focus on the subindices and the survey of the services sector for additional clues about the direction of the economy. After learning about the Richmond Manufacturing Index, who compiles it, its formula, examples of RMI, when the index is released, and how the stock market reacts, you can explore more through the GIC Journal. You can register through our official website to start depositing from 150,000 Rupiah!


