 Last:
Last: 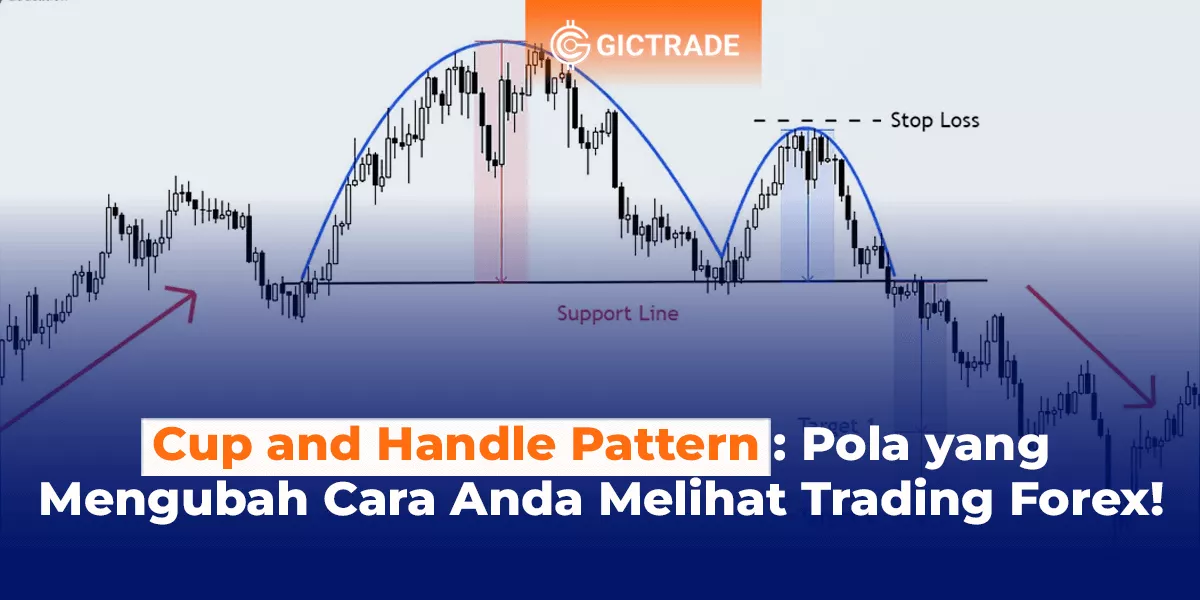
Cup and Handle Pattern - Stocks are a popular investment instrument throughout the world, including Indonesia. However, most people consider stocks to be a high-risk investment. However, if we have the right knowledge and strategy, stock investment can be very profitable.
.webp)
One of the popular strategies used by traders is chart patterns, such as the "cup and handle pattern". This pattern has proven effective in identifying potential increases in stock prices. In this article, we will discuss more about the cup and handle pattern and how to use it in stock trading in Indonesia.
Table of Contents
What is Cup and Handle Pattern?
Cup and Handle Pattern is a chart pattern that is often used by stock traders in technical analysis. This pattern consists of two parts, namely the cup and the handle. The cup and handle pattern usually appears after a period of significant price increases and indicates the possibility of further price increases.
The cup part of this pattern is shaped like a cup or bowl, which is usually formed because the stock price has reached its highest point and then experienced a correction. Meanwhile, the handle part of this pattern is formed when the stock price rises again and reaches its previous level before experiencing a correction.
The cup and handle pattern usually appears after a period of significant price increases and indicates the possibility of further price increases. When the stock price passes the resistance level formed from the peak of the cup, this can be a signal for traders to buy shares.
The cup and handle pattern is often used in technical analysis because it can provide a clear signal regarding the potential for an increase in stock prices. However, as in stock trading in general, there is a risk of loss that needs to be considered. Therefore, it is important for traders to conduct a good analysis before making decisions in stock trading.
How to Recognize Cup and Handle Pattern
Cup and Handle Pattern can be recognized by looking at the chart pattern formed on the stock price chart. Here's how to recognize the cup and handle pattern:
- Find a cup pattern: Note whether there is a part of the chart that forms a cup or bowl pattern with a clear resistance level at the highest point.
- Identify the handle: After the cup is formed, note whether there is a stock price movement that experiences a correction to a lower level and then rises again before reaching the resistance level in the cup.
- Confirm the buy signal: If the stock price manages to pass the resistance level in the cup, this can be a signal for traders to buy shares.
- Ensure sufficient trading volume: In addition to recognizing chart patterns, traders also need to pay attention to sufficient trading volume when the cup and handle pattern occurs. High trading volume when this pattern occurs can indicate high buying interest from traders.
- Conduct a thorough technical analysis: In addition to recognizing chart patterns, traders also need to conduct a thorough technical analysis before deciding to buy shares. Technical analysis includes the use of indicators such as moving averages, MACD, or RSI to help identify potential increases in stock prices.
In stock trading, recognizing chart patterns correctly is the key to success in making a profit. However, as in stock trading in general, the risk of loss also needs to be considered. Therefore, it is important for traders to conduct a thorough technical analysis before making decisions in stock trading.
Why Does the Cup and Handle Pattern Occur?
The Cup and Handle Pattern occurs because of a significant increase in stock prices, then a correction before rising again. Here are some factors that can influence the occurrence of the cup and handle pattern:
- Investor buying action: The cup and handle pattern can occur when investors or traders buy stocks in large volumes when the stock price is corrected. This can cause the stock price to rise again and form the handle section of the cup and handle pattern.
- Stock price correction: The cup section of the cup and handle pattern is formed because the stock price has increased significantly before experiencing a correction. This correction can occur due to selling actions by investors who want to make a profit or due to external factors such as unstable market conditions.
- Resistance level: The cup and handle pattern can occur when the stock price reaches the resistance level at its highest point before experiencing a correction. This resistance level can be a critical point that determines whether the stock price will rise again or fall.
- High buying interest: The cup and handle pattern can occur when there is high buying interest from investors in a particular stock. This can cause the stock price to increase significantly and form the cup part of the cup and handle pattern.
The cup and handle pattern can be a fairly accurate signal for traders in making decisions in stock trading. However, as in stock trading in general, the risk of loss also needs to be considered.
Therefore, it is important for traders to conduct good technical and fundamental analysis before making decisions in stock trading.
Overall, the Cup and Handle Pattern is a powerful technical indicator and can help traders make more confident trading decisions. However, traders need to pay attention to risk management and conduct good technical and fundamental analysis before entering a trading position.
What is the Cup and Handle Pattern?
How to recognize the Cup and Handle Pattern?
Can the Cup and Handle Pattern be used in forex trading?
What are the advantages of using the Cup and Handle Pattern in forex trading?
Can the Cup and Handle Pattern be relied on as a technical indicator in forex trading?
How to use the Cup and Handle Pattern in forex trading?
What are the risks to consider when using the Cup and Handle Pattern in forex trading?
How to Use Cup and Handle Pattern in Forex Trading
The Cup and Handle Pattern is one of the most popular chart patterns among forex traders. This pattern is used as an indicator of a bullish trend, and can help traders make decisions in forex trading. Here's how to use the cup and handle pattern in forex trading:
- Identify the cup and handle pattern: The first thing to do is identify the cup and handle pattern on your forex chart. The cup and handle pattern is usually formed after the stock price has increased significantly, then experienced a correction before rising again. This pattern consists of a cup and a handle that are formed after the price correction.
- Identify support and resistance levels: Once the cup and handle pattern has been identified, the next step is to determine the support and resistance levels in this pattern. The support level is at the base of the cup, while the resistance level is at the top of the cup.
- Confirm trend direction: Once the support and resistance levels have been determined, traders need to confirm the trend direction. The cup and handle pattern is an indicator of a bullish trend, so traders should look for signs that the price will rise. This could be a price that continues to rise after the handle is formed, or the possibility of a price breakout above the resistance level.
- Enter a buy position: Once the trader is sure that the trend direction is bullish, the next step is to enter a buy position above the resistance level. Traders need to pay attention to risk management, such as determining stop loss and take profit, and pay attention to fundamental factors that can affect forex prices.
- Exit position: After entering a buy position, traders need to monitor price movements and exit the position if the price moves against expectations. Traders can also consider taking profits gradually by selling positions gradually.
The cup and handle pattern is one of the technical indicators that can help traders make decisions in forex trading. However, as in forex trading in general, traders need to pay attention to risk management and conduct good technical and fundamental analysis before entering a trading position.
Advantages of Using the Cup and Handle Pattern in Forex Trading
Using the Cup and Handle Pattern in forex trading has several advantages, including:
- Helps identify bullish trends: The Cup and Handle Pattern is a strong indicator in identifying bullish trends on forex charts. This pattern is formed after the stock price experiences a significant increase, then experiences a correction before rising again. Thus, traders can use this pattern to identify the right moments to enter a buy position and take advantage of the price increase.
- Provides clear entry and exit signals: In forex trading, clear entry and exit signals are essential to minimize risk and optimize profits. The Cup and Handle Pattern provides a clear entry signal when the price breaks through the resistance level at the top of the cup. In addition, traders can also use the support level at the base of the cup as a stop loss level if the price moves against expectations.
- Suitable for short-term and long-term traders: The Cup and Handle Pattern is suitable for short-term and long-term traders. For short-term traders, this pattern can be used to identify daily trading opportunities and take advantage of rapid price fluctuations. For long-term traders, this pattern can be used to predict the direction of the long-term trend and take advantage of price increases over a longer period of time.
- Reduces trading risk: The Cup and Handle pattern can help traders reduce trading risk by providing clear entry and exit signals. Traders can use the support and resistance levels in this pattern as stop loss and take profit levels, thereby minimizing losses and optimizing profits.
- Easy to identify: The Cup and Handle Pattern is an easy-to-identify chart pattern that is often seen on forex charts. This makes it easy for traders to use it as a technical indicator in forex trading.
Overall, the Cup and Handle Pattern is a powerful technical indicator and can help traders make more confident trading decisions. However, traders need to pay attention to risk management and conduct good technical and fundamental analysis before entering a trading position.
FAQs
Here are some common questions that often arise about the Cup and Handle Pattern in forex trading:
What is the Cup and Handle Pattern?
The Cup and Handle Pattern is a technical chart pattern that forms when a stock price experiences a significant increase, then experiences a correction before rising again. This pattern is shaped like a cup with a handle on the right side.
How to recognize the Cup and Handle Pattern?
The Cup and Handle Pattern can be recognized by looking at the price pattern on the forex chart. This pattern is formed when the stock price experiences a significant increase, then experiences a correction before rising again by forming a pattern like a cup with a handle on the right side.
Can the Cup and Handle Pattern be used in forex trading?
Yes, the Cup and Handle Pattern can be used in forex trading as one of the technical indicators to help traders make trading decisions.
What are the advantages of using the Cup and Handle Pattern in forex trading?
Some of the advantages of using the Cup and Handle Pattern in forex trading are that it helps identify bullish trends, provides clear entry and exit signals, is suitable for short and long-term traders, reduces trading risk, and is easy to identify.
Can the Cup and Handle Pattern be relied on as a technical indicator in forex trading?
The Cup and Handle Pattern can be relied on as a technical indicator in forex trading, but it is not completely accurate. Traders need to pay attention to risk management and conduct good technical and fundamental analysis before entering a trading position.
How to use the Cup and Handle Pattern in forex trading?
To use the Cup and Handle Pattern in forex trading, traders can utilize the entry and exit signals generated by this pattern, and pay attention to the support and resistance levels at the base of the cup as stop loss and take profit levels.
What are the risks to consider when using the Cup and Handle Pattern in forex trading?
Some of the risks to consider when using the Cup and Handle Pattern in forex trading are market uncertainty, price volatility, and fundamental factors that can affect market prices. Therefore, traders need to pay attention to risk management and conduct good technical and fundamental analysis before entering a trading position.
Overall, the Cup and Handle Pattern is one of the technical indicators that can help traders make trading decisions with more confidence. However, traders need to pay attention to risk management and conduct good technical and fundamental analysis before entering a trading position.
Conclusion
In forex trading, the Cup and Handle Pattern can be one of the useful technical indicators to help traders identify bullish trends and provide clear entry and exit signals. This pattern is easy to identify and is suitable for both short-term and long-term traders.
However, as with other technical indicators, the Cup and Handle Pattern also has weaknesses and risks. Traders need to pay attention to risk management and conduct good technical and fundamental analysis before entering a trading position.
In addition, not all price patterns will form a Cup and Handle Pattern, so traders need to pay attention to market conditions and fundamental factors that can affect market prices.
Overall, the Cup and Handle Pattern can be one of the useful tools in forex trading if used wisely and accompanied by good risk management. Traders need to learn and practice consistently to understand this pattern and maximize profit potential in forex trading.
References:
Murphy, John J. (1999). Technical Analysis of the Financial Markets. New York Institute of Finance.
Bulkowski, Thomas N. (2010). Encyclopedia of Chart Patterns. Wiley.
Tharp, Van K. (2007). Trade Your Way to Financial Freedom. McGraw-Hill.
Lebeau, Charles and Lucas, David (1991). Technical Traders Guide to Computer Analysis of the Futures Markets. McGraw-Hill.
Schwager, Jack D. (1995). Technical Analysis. New York Institute of Finance.


