 Last:
Last: 
What is Retail Sales
Retail sales involve the purchase of finished goods and services by consumers and businesses. These goods and services have reached the end of the supply chain, which starts with manufacturers or suppliers of goods and ends with retailers. The beginning of the supply chain involves commodities and other raw materials. Manufacturers produce the products. The middle of the supply chain is wholesale sales, where goods and services are distributed to retailers. Retailers then sell them to end consumers. Retail sales refer to the sale of consumer goods, or finished goods, by businesses to end consumers and include both in-store and online sales. Products may be durable (with an estimated significant lifespan) or perishable (such as food). Food, clothing, and furniture are some common examples of consumer goods. Raw materials, like copper or unprocessed plastic, are not considered consumer goods, as they must first be used to manufacture finished products.What are Core Retail Sales?
Core Retail Sales is a measure of retail sales that excludes sales of automobiles, gasoline, and building materials. Retail refers to the sale of goods or services to customers through various distribution channels for profit. The retail sector is an important part of the economy because it contributes a significant portion of consumer spending. Core Retail Sales provides a more accurate picture of consumer spending on selected goods by excluding the volatility of sectors such as automobiles, gasoline, and building materials. This measure is valuable to economists as it removes the volatility from these fluctuating sectors and offers a clearer picture of underlying consumer spending. Consumer spending is a major driver of economic growth, so understanding how much consumers are spending helps economists better understand the performance of the economy. Recent strong growth in Core Retail Sales suggests that consumers are feeling confident and spending more, which is good news for the retail sector that has faced challenges in recent years. Strong growth in retail sales is a sign that the economy is doing well, and consumers are optimistic about the future.Types of Retail Sales Data
Here are the 4 types of retail sales data available. These types are:- Sales Data
- Inventory Data
- Operational Data
- Customer Data

How to Read Retail Sales Numbers
Here are the ways to read retail sales numbers. These are:1.TREND DATA – to leverage time variations in POS data for a different perspective.
Retailers' scanned sales systems typically allow for flexible and customizable time period views. These can include 52-, 26-, 12-, and 4-week periods, fiscal year and calendar-year-to-date, plus comparisons versus the previous year. It can also include 4 weekly seasonal trend analyses, daily analysis, and even hourly results. It is important for retailers to monitor results through effective company reports and scorecards. Make sure you look at both short-term and long-term trends when reviewing your business. Short-term trends can proactively help you address issues before they expand into long-term trends.2. OUT OF STOCK DAN IN-STOCKS - to determine stocking schedules at the store level.
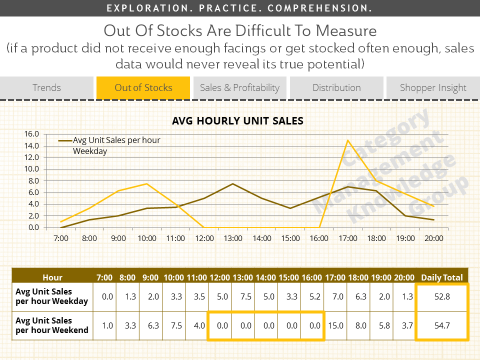
Out of Stock (OOS) sales loss might be one of the most difficult things to measure. Hourly sales data with significant gaps would be a strong indicator of OOS issues, as would market share that is significantly lagging combined with full distribution. Looking at hourly data with sales gaps demonstrates the power of hourly data. If you only look at average units per day, you won't see the difference between weekday and weekend sales. You might plan shelf capacity based on these numbers. However, by looking at hourly sales, you can identify OOS issues during what should be peak sales times.
3. SALES AND PROFIT ANALYSIS – to understand brand, segment, category, department, aisle, and total store results.
In addition to standard sales metrics such as $ sales, unit sales, and profit, scanned retailer data also allows you to track Same Store, or Comp Store Sales. "Comp Store Sales" is a measure of revenue productivity used to compare sales at retail stores that have been open for one year or more. Historical sales data allows retailers to compare this year’s sales at their stores with the same period last year. These steps enable retailers to measure how effective their programs are in driving organic growth versus growth from new store expansions.4. DISTRIBUTION ANALYSIS – to track new items, product availability, and product variety.
Tracking new items can be easily and accurately done by creating reports that track the percentage of stores selling the item. Here, distribution will only be recognized after the first sale is recorded. The metric "% of Stores with Sales" captures the percentage of stores selling the product. Analyses like this provide a perspective on how quickly a product moves through the supply chain – from the warehouse, to store receiving, and then out of the backroom and onto the shelves. A drawback of measuring distribution this way is that if a product doesn’t sell, it won’t be recorded. However, if a retailer has a strategy to be the first to market a popular new product, this will reflect how well that strategy is implemented through operations.5. SHOPPER INSIGHT - to gain insights into shopper behavior and shopping carts.
Basket analysis provides significant insights into shopper behavior. The shopping basket can be viewed in various ways and used to evaluate how well a retailer can deliver results against a specific strategy. In the following example, the retailer introduces a multi-buy strategy – encouraging multiple purchases through "2 for" or "3 for" incentives for consumers. They want to know if their strategy is successful based on this data.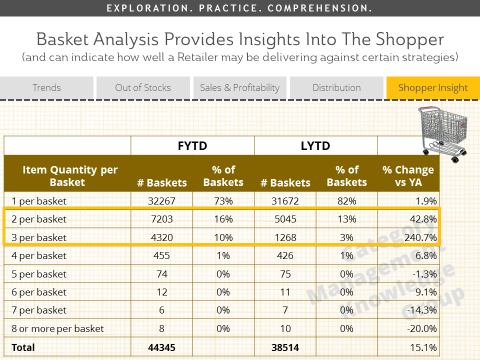
By comparing the quantity of items per basket for the current period when the new strategy is applied, with the previous period, we can see if we are driving an increase in multi-buy purchases. This example shows a significant increase in 2-item and 3-item baskets, with growth rates of 43% and 241%, respectively, compared to the total basket growth of 15%. Scanned retail sales data can provide valuable insights. Since all categories are available down to the item level, the analytical capabilities are limitless! Scanned sales data allows for strong and flexible analysis, including profitability, promotions, pricing, and in-depth choice analysis, as well as shopping basket and loyalty analysis.
The Influence of Retail Sales Data in Forex
The Forex market's attention is constantly focused on retail sales data releases for almost all major currencies. In fact, the Forex market is considered one of the most dynamic financial markets in the world. This dynamism is one of its main advantages because any trader can take advantage of changes if they play smart, but it's also important to note that several factors can reverse the situation. Retail sales reports are one of these factors because they are a key indicator of economic growth. Retail sales data is influential among the most important scheduled economic reports to be released in the U.S. and other countries such as the U.K. and the Eurozone. Generally, these reports affect most of the U.S. Dollar pairs. Each month, the U.S. Department of Commerce releases the preliminary retail sales data estimate. Therefore, the forex fundamental calendar will be affected by this report, which includes Retail Sales for the previous month. Market participants are likely to look at the report for each category. As a result, Forex market trends may be influenced by their decisions about stocks and bonds. Forex traders, however, look at the overall percentage of the report rather than each aspect. With retail sales higher than expected, the economy is heading in the right direction. However, this may not happen during significant holidays, such as Easter in the EU or Christmas in the United States. Nevertheless, an increase is typically expected during these times. Thus, an increase in Retail Sales data will have only a minor impact on the market. Forex traders, however, would do better to check all the different interpretations of worsening Retail Sales reports before thinking the economy is heading south. After learning about core retail sales, types, how to read, and the impact of retail sales data on forex, you can read other articles or trivia through the GIC Journal. Additionally, if you want to trade, you can register at GIC, which is the first platform in Indonesia that prioritizes both sides, traders and market makers. This ensures more transparent transactions. Register now to enjoy the GIC features!


