 Last:
Last: 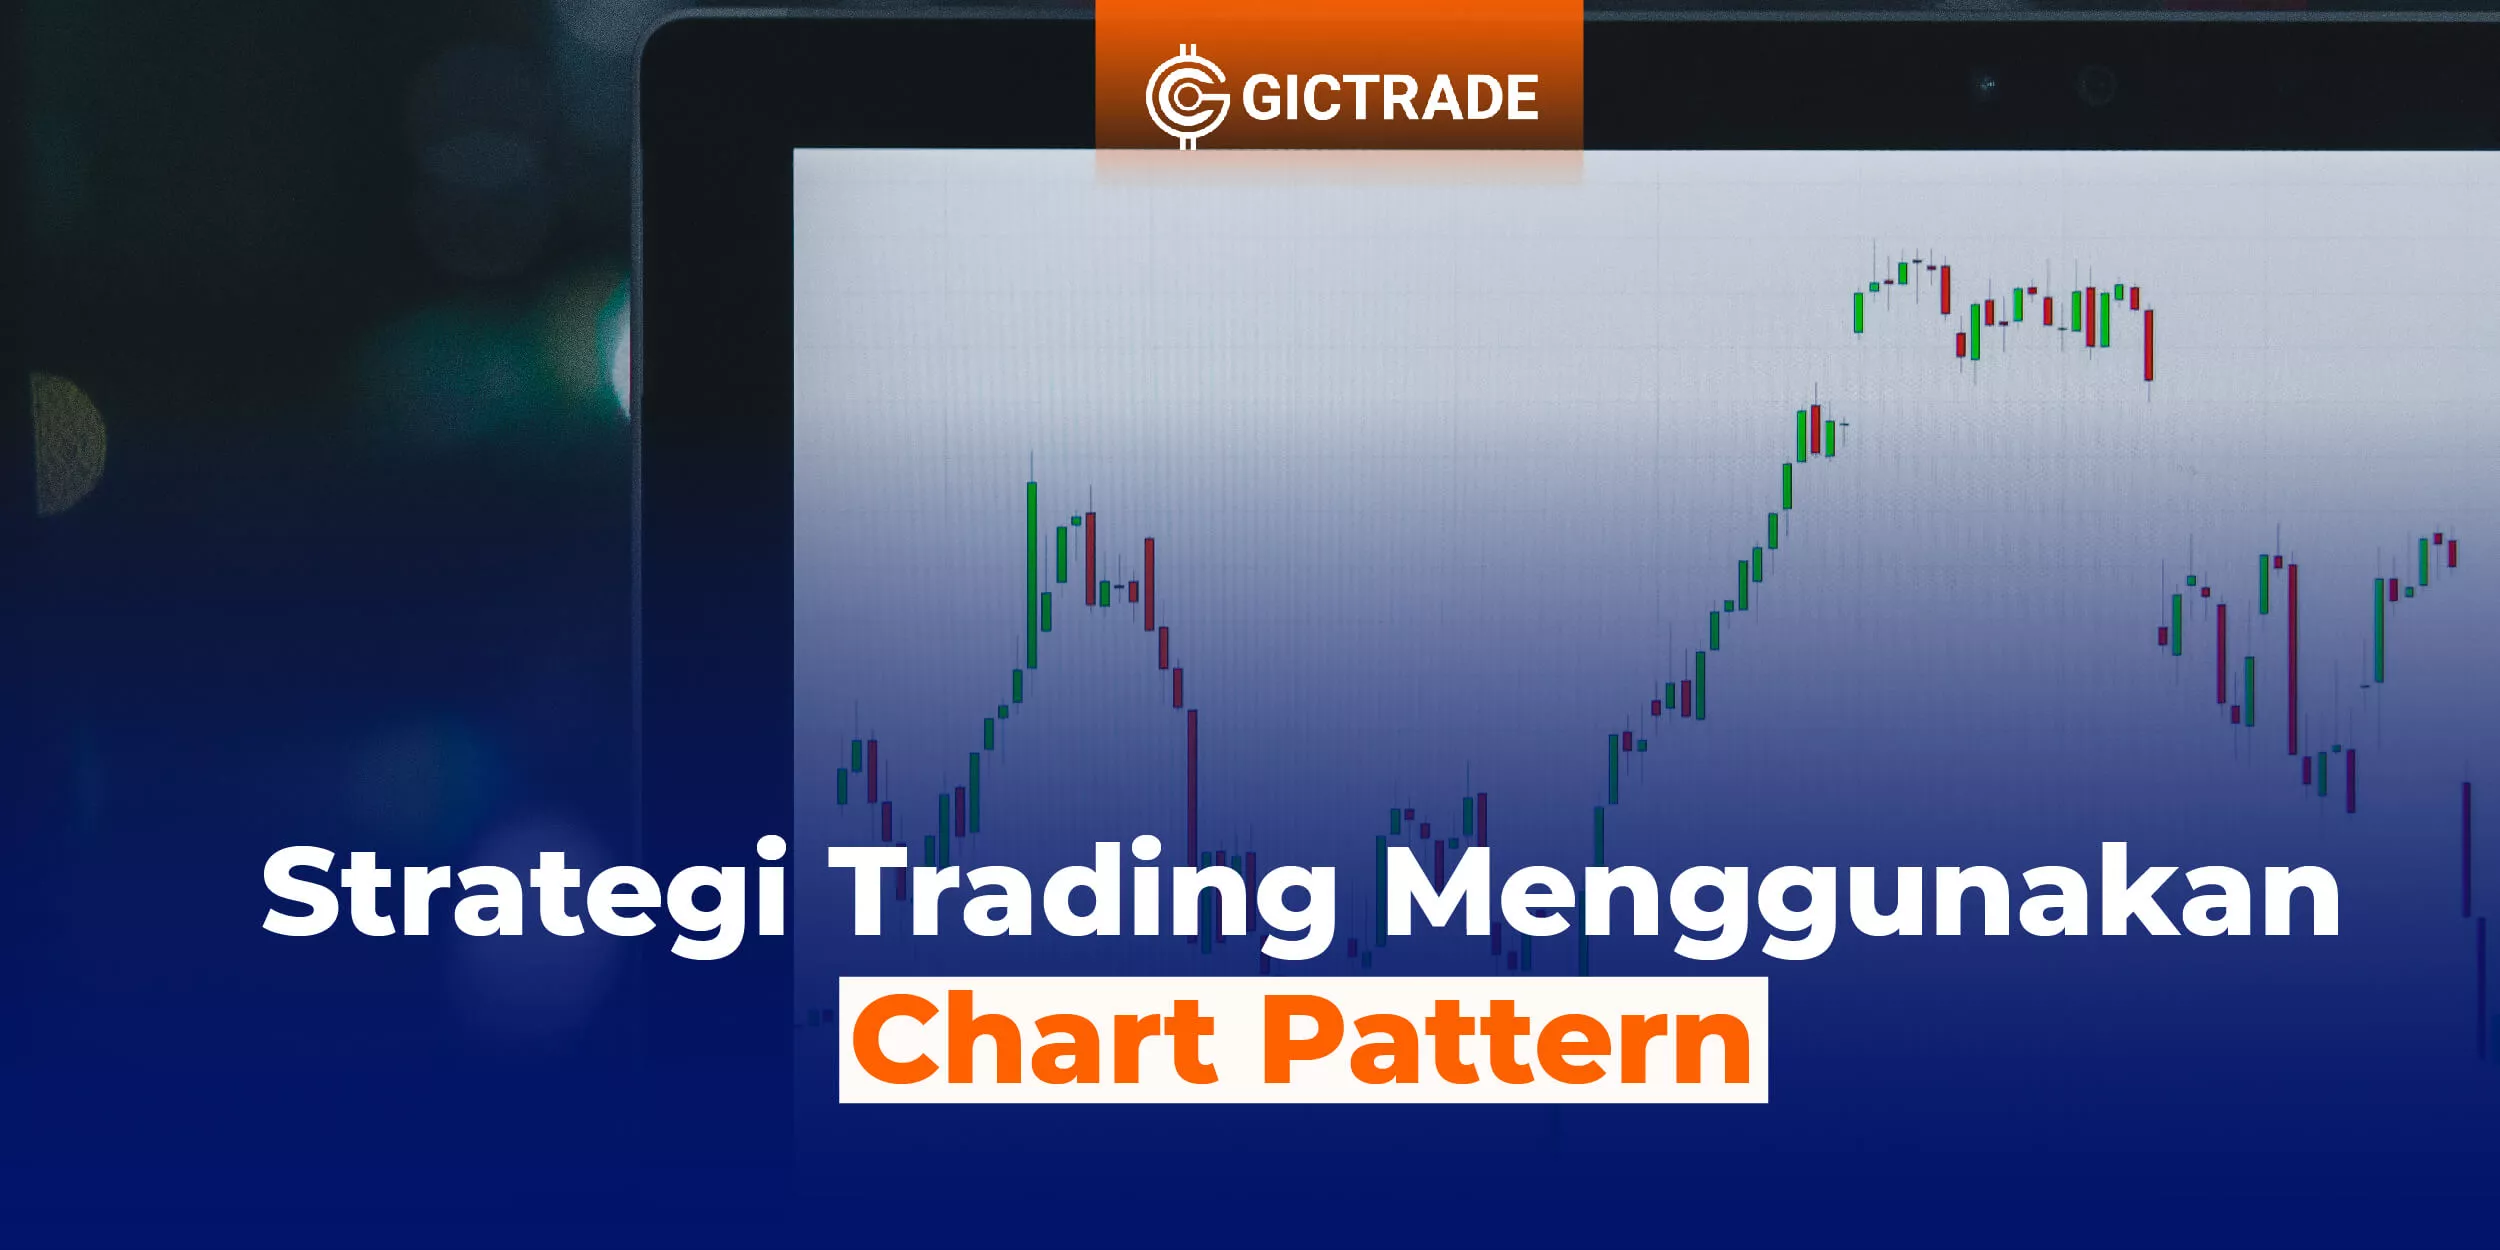
Trading Strategies Using Chart Patterns - Trading is one way to make money in the financial markets. For some people, trading can be a stable source of income. However, for some other people, trading can be a challenging and difficult job to do. The key to success in trading is to have the right strategy. One of the strategies widely used by traders is to use chart patterns.
.webp)
Chart patterns are patterns on the chart that show the direction of price movement. By understanding these patterns, traders can determine when to buy or sell an asset. In this article, we will discuss how to use chart patterns in stock and forex trading.
Table of Contents
How to Use Chart Patterns in Stock and Forex Trading
1. Recognizing Patterns on Charts
To be able to use chart patterns, traders need to recognize patterns on the chart. These patterns can be either bullish or bearish patterns. A bullish pattern indicates that the price will rise, while a bearish pattern indicates that the price will fall. Here are some bullish and bearish patterns that often appear on charts:
- Bullish Pattern
- Hammer Pattern
- Inverted Hammer Pattern
- Morning Star Pattern
- Bullish Engulfing Pattern
- Bearish Pattern
- Shooting Star Pattern
- Inverted Hammer Pattern
- Evening Star Pattern
- Bearish Engulfing Pattern
Once traders recognize the patterns on the chart, they need to pay attention to the pattern formation to determine the right course of action. If you still don't understand much about the patterns above, maybe you can get to know them more here.
2. Understanding Pattern Formation
After recognizing the patterns on the chart, traders need to understand the pattern formation to determine the right course of action. There are several things that need to be considered in understanding pattern formations, including:
- Time
Traders need to pay attention to the timing of the pattern. Patterns that occur in a short period of time may not have a significant impact on the price of an asset, whereas patterns that occur over a long period of time can have a large impact on the price of an asset.
- Volume
Traders need to pay attention to the trading volume at the time of the pattern. Patterns that occur with high trading volume tend to be more trustworthy than patterns that occur with low trading volume.
- Trend
Traders need to pay attention to the trend of price movements before the pattern occurs. Bullish patterns that occur in an uptrend tend to be more trustworthy than bullish patterns that occur in a downtrend. Conversely, bearish patterns that occur in a downtrend tend to be more trustworthy than bearish patterns that occur in an uptrend.
Also Read : 5 Best Types of Chart Patterns
3. Determining the Action
After understanding the pattern formation, traders need to determine the right action. The action taken will depend on the type of pattern and the market conditions at the time of the pattern. Here are some actions that traders can take:
Action for Bullish Patterns
- Buy: If a bullish pattern forms at a support level, traders can buy the asset. Conversely, if a bullish pattern forms at a resistance level, traders should wait for confirmation before buying the asset.
- Hold: If a trader has already bought an asset before the bullish pattern occurs, they can hold the position until the price reaches a resistance level. However, if the price does not reach the resistance level and instead drops back, traders should sell the asset.
- Sell: If a bullish pattern forms at a resistance level, traders should sell the asset. However, before selling, traders need to make sure that the bullish pattern is completely valid and not just a false signal.
Actions for Bearish Patterns
- Sell: If a bearish pattern forms at a resistance level, traders can sell the asset. However, if a bearish pattern forms at a support level, traders should wait for confirmation before selling the asset.
- Hold: If a trader has already sold an asset before the bearish pattern occurs, they can hold the position until the price reaches a support level. However, if the price does not reach the support level and instead rises again, traders should buy back the asset.
- Buy: If a bearish pattern forms at the support level, traders should buy the asset. However, before buying, traders need to make sure that the bearish pattern is completely valid and not just a false signal.
4. Using Technical Indicators
In addition to using chart patterns, traders can also use technical indicators to help them make trading decisions. Some of the technical indicators that are often used are:
- Moving Average
A moving average is an indicator that shows the average price over a period of time. Traders can use moving averages to see the direction of the price movement trend.
- Relative Strength Index (RSI)
The RSI is an indicator that indicates the strength of the price. If the RSI is above the 70 level, it means that the price is overbought and a correction is likely. Conversely, if the RSI is below the 30 level, it means that the price is oversold and there is likely to be a rebound.
- Bollinger Bands
Bollinger Bands are indicators that indicate support and resistance levels. If the price approaches the support or resistance level indicated by the Bollinger Bands, traders can take action accordingly.
5. Using Proper Risk Management
Risk management is one of the keys to success in trading. Traders need to pay attention to risk management so as not to lose capital in trading. Some ways that can be done to use the right risk management are:
- Stop Loss
A stop loss is a price level at which a trader will automatically close a position if the price reaches that level. By using a stop loss, traders can limit the losses that may occur.
- Take Profit
Take profit is the price level at which a trader will automatically close a position if the price reaches that level. Using take profit, traders can take advantage of positions that have already been opened.
- Risk/Reward Ratio
The risk/reward ratio is the comparison between the potential profit and potential loss in a trading position. Traders need to pay attention to the risk/reward ratio to ensure that the potential profits outweigh the potential losses.
FAQ (Frequently Asked Questions)
Chart patterns are patterns on the chart that show the direction of price movement.
How to use chart patterns in stock and forex trading?
To use chart patterns, traders need to recognize patterns on the chart, understand pattern formations, and determine the right action.
What are some actions that traders can take when a bullish or bearish pattern occurs?
The actions that can be taken depend on the type of pattern and the market conditions at the time of the pattern. However, in general, traders can buy, sell, or hold open positions.
What are some technical indicators that are often used in trading?
Some of the technical indicators that are often used are moving averages, relative strength index (RSI), and Bollinger Bands.
What is risk management in trading?
Risk management is a way to minimize losses and maximize profits in trading. Some ways that can be done are using stop loss, take profit, and risk/reward ratio.
Want to Get Maximum Profit Fast? Join GICTrade Now!
Not familiar with GIC? Let's get acquainted. Unlike other conventional brokerage firms, GIC through the GICTrade platform provides a solution for traders who do not want to be charged with high trading fees. GICTrade is a peer-to-peer trading platform that brings together traders and market makers.
So, what is special about GICTrade? As a platform that brings together traders and market makers, you as a potential customer can certainly choose between the two, namely becoming a trader or a market maker.
GICTrade's role as a transaction venue provider can minimize costs and help maximize profits for traders and market makers as well as create a fair transaction atmosphere and results.
Traders will benefit from the absence of commission fees and low swap fees and spreads due to the presence of market makers as liquidity providers. You can also join the trader community on GICtrade's Telegram to ask fellow traders directly about their trading experience.
Conclusion
Trading strategies using chart patterns can help traders make the right decisions in stock and forex trading. By recognizing patterns on charts, understanding pattern formations, using technical indicators, and using proper risk management, traders can increase their chances of success in trading. However, traders need to note that chart patterns are not the only way to trade and that risks remain in trading.


