 Last:
Last: 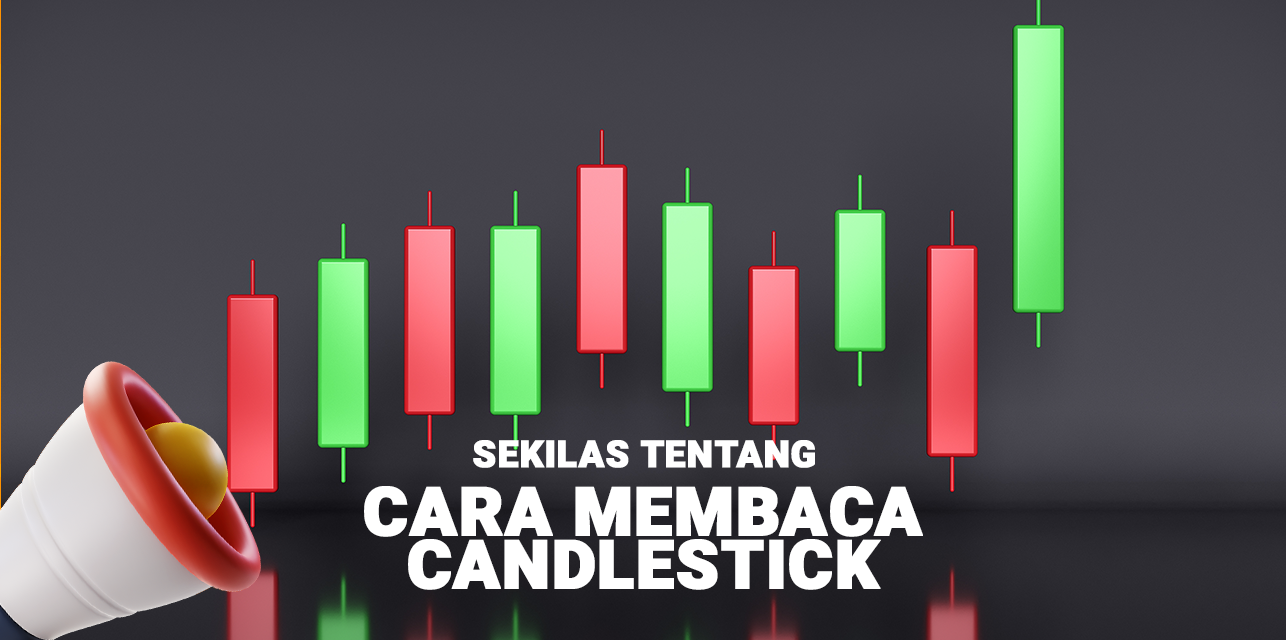
It is no stranger to traders who have traded frequently to encounter candlesticks every day. So for beginner traders, there is no need to be discouraged if you can't read the candlestick.
There is a way to read candlesticks that you can apply when opening the trading chart itself. For that, this time we will learn how to read the candlestick itself. How to read this candlestick will be very easy if you follow the steps that have been summarized in this discussion.
There are various types of candlesticks that must be studied along with their characteristics. But before learning how to read these candlesticks, you can download the application of GICTrade so that you can trade in real time and apply what you have learned about candlesticks with GIC.
Definition of Candlestick in Trading
The term candlestick chart is used by many traders to indicate a market price. Because visually this candlestick chart is easy to understand and also the information presented in each candlestick is quite complete, including the opening price, lowest price, highest price, and closing price. These candlesticks will generally be used for short-term trading, so they will be more suitable for traders.
One of the advantages of candlesticks is that they are able to display a market psychology easily. Generally, it can describe a state of market price that is experiencing an increase (bullish), with the use of green or white candlesticks. Meanwhile, to describe a state of declining market prices (bearish), the candlestick used is red or black.
The candlestick itself will represent the impact of investor sentiment on the market price. This kind of analysis will be useful for investors to be able to determine the right time to trade. This method also helps in the analysis of financial assets, such as stocks, cryptocurrencies, as well as forex.
The use of candlestick charts is included in the category of discretionary methods. That is, the candlestick will use subjective intuition. There are various kinds of patterns that can be analyzed on the chart that can later be resolved in actual trading. Candlesticks themselves can generate stable profits if traders have qualified flying hours.
History of Candlesticks
The history of this candlestick has started centuries ago, namely in Japan to be precise. This candlestick is used by a rice trader in Japan to observe and also analyze the movement of rice prices in the market. The history of this candlestick method can be said to have started from the 16th century. In the late 1500s to the mid-1700s, Japan, which already had 60 provinces, was a country with a rapidly growing trade route.
Munehisa Homma is a rice entrepreneur who was in Japan in 1700 who is most famous for predicting the movement of rice prices in his time by using past prices. This starts from a routine record of prices at the opening, closing, highs, and lows in the market every day. These Japanese people began using such technical analysis to trade rice in the 17th century.
This early version of technical analysis would be different from the American version that had been conceived by Charles Dow in the 1900s. According to Steve Nison, these candlestick charts first appeared after the 1850s. Most of the credit for the development of charts and candlesticks goes to a legendary rice merchant named Homma from the city of Sakata.
His original idea may have been modified and improved through his trading practice over the years, until finally the candlestick graphical system is the one in use today. Before proceeding to the advantages of using this candlestick, you can fill out the Trader Assessment to consult about your trading and ask everything about trading itself.
Table of Contents
- Pengertian Candlestick pada Trading
- Sejarah Candlestick
- Keunggulan Candlestick
- Elemen Utama Candlestick
- Peperangan dalam Candlestick
- Cara Membaca Candlestick Forex agar Selanjutnya Bisa Profit
- FAQ terkait Cara Membaca Candlestick
- Bagaimana Cara Membaca Candlestick dalam 1 Menit?
- Bagaimana Cara Membaca Candlestick di Binomo?
- Bagaimana Cara Membaca Candlestick Saham?
- Bagaimana Cara Membaca Candlestick Crypto?
- Bagaimana Cara Membaca Candlestick di Indodax?
- Bagaimana Cara Membaca Candlestick di Oxtrade?
- Bagaimana Cara Membaca Candlestick di Quotex?
Advantages of Candlesticks
In the use of candlesticks, there are also advantages that can be obtained when trading itself. The advantages of such candlesticks are:Analysis made easier
Traders can quickly find out who will control the market, whether bull or bear, just by looking at the color of the body candlestick. In addition, the length of the body of the candlestick will also show how dominant the condition of the bull or bear, if the body is short and the shadow is long, it will show market doubt. This is different from the bar chart where we must pay attention first to the details of the opening and closing price on the bar.Fast-changing trend signal indicator
Candlesticks will also help traders to analyze market conditions so that they will be very good at giving signals on rapid trend changes. This candlestick forex strategy will be perfect for traders who are aggressive and also quick to react to market changesIn fact, often the signals that appear are faster when compared to using an indicator so that candlesticks can be used as a reference for entry and exit.
Complementary indicators in technical analysis
In the technical analysis itself, the use of this candlestick pattern can be used as a confirmation tool that will be used together with several existing indicators. For example, during a downtrend, then a Morning Star pattern appears which is the end signal of a downtrend and the beginning of a bullish occurrence.Key Elements of Candlesticks
The candlestick itself has several constituent elements of the existing shape. The main element is: The body of this Candlestick is the first point that will help a person to obtain various kinds of price information from trading. The length of the candlestick body will indicate a strength from one side which means that the momentum will be stronger if the body size will be extended.
And vice versa, if the size of the candlestick shrinks, the momentum rate of the candlestick itself will be slower. Chandlestick Wick Length In binary options candlestick strategies, the length of the wick will provide information regarding the volatility of the price movement in the trade. A long wick will indicate a rapid price movement in the duration of the candle, but will get rejection due to resistance. Meanwhile, if the axis gets longer, it will indicate increased volatility. This condition often occurs at the end of a trend.
Before the price returns to its initial condition, or when the price is approaching an important Support Resistance. Body Length and Axis Ratio From here a trader can see the big picture of the concept of a candlestick that is happening. When you find that the candlestick has a long body size with a shrinking axis, then that's when the trend is experiencing high momentum.
Meanwhile, when finding a candlestick that already has a smaller body size while the wick is elongated, the market is in an uncertain state. This can also lead to an increase in volatility. Candlestick Body Position The last element in how to read a candlestick is to look at the position of the candlestick body itself.
When this candlestick has a long wick and the position of the body is at one end, there is resistance. Meanwhile, if the position of the body is in the middle of the upper and lower axes, it indicates that there is a market uncertainty. By knowing some of the discussions above, you can invite your friends to understand this knowledge and join to trade with GIC. Or you can also become an IB and get various benefits and additional money to trade yourself.
also read :
Candlestick Wars
The war in question is a battle between demand and supply and demand. And each of those candlesticks is a picture of the outcome of the ongoing price battle.
- Green and long candlesticks This will indicate that the buyer traders are in full control. The longer the candlestick will show a very large buying interest as well.
- Red and long candlesticks This would indicate that the selling traders are in full control. The longer the size of the candlestick itself, it will show a very large selling pressure.
- Small candlesticks (both green and red) will indicate that both buying and selling traders cannot move the price too far and the price is close to the opening position.
- Small body candlestick with tail extending downwards This will indicate that the buying trader will put up a major resistance. Selling traders who had been in control by pushing the price down before finally the buying traders would put up a considerable resistance and also lift the price back to around the opening level.
- Small body candlestick with tail extending upwards This will indicate that the selling traders will put up a big resistance. Buying traders will have time to take control by lifting the price upwards before in the end the selling traders will put up a considerable resistance and can pressure the price to fall back to around the opening level.
-
A small body candlestick between two long tails will indicate that both the buying and selling traders will each have a balanced power in controlling the market price, so neither of them wins or loses.
How to Read Forex Candlesticks to Make a Profit Next
In how to read candlesticks, there are 3 basics that you must understand, including 4 price positions, axis direction, green and red colors. Here's the explanation.Four Price Positions on a Candlestick
In candlestick charts, there are 4 important indicators including :- Low, for the lowest price that occurred today.
- Open, for the price at the time of the trade or the trade opened today.
- Closed, the price after trading closed yesterday.
- High, indicating the highest price of the day.
When the body is elongating, this means that the momentum is strengthening. However, if the body of the candle shrinks, it means that the momentum is getting slower.
Meaning of Green and Red Candlestick Colors
When the candlestick has a green color, it means that the open price is high or even higher than the closed. Usually this pattern is also called a bullish candlestick.
However, when the candlestick is red, it will indicate that the open price at that time is lower than when it is closed or commonly known as a bearish candlestick. When the candlestick is green, then the candlestick itself is moving upwards. While when it is red, the candlestick moves downwards.
However, when the candlestick is red, it will indicate that the open price at that time is lower than when it is closed or commonly known as a bearish candlestick. When the candlestick is green, then the candlestick itself is moving upwards. While when it is red, the candlestick moves downwards.
Candlestick Wick
When the wick looks longer and pointing downwards, it will indicate that market participants have pushed the price down. Those that are not strong enough to sustain the price, will remain in a low position.
At the same time, other market participants will even make purchases that can eventually cause prices to rise. As for this phenomenon, it will be called a bullish reversal. This will also apply the other way around, when the wick is at the top, then this is a sign that investors or traders who are taking profits can be more than those who decide to hold. This phenomenon will be named as a bearish reversal.
Candlestick Body Position
If you see a long wicked candlestick in the position of the body located on one of the ends, then this will indicate resistance. Meanwhile, the position of the candlestick in the middle of the upper and lower wicks will show the uncertainty that exists in the market.
You can read related references from various types of candlestick patterns themselves. However, insight into the elements must also be prioritized. If you know each of these elements well, then you can also master candlestick readings accurately.
FAQs related to How to Read Candlesticks
An open that shows the price of an asset at the time a trade starts at a certain time period.
A close that indicates the price when a trade has been closed at a certain period of time.
The high and low components represent the highest and lowest prices reached by an asset over a period of time.
How to Read a Candlestick in 1 Minute?
To be able to find out from your trading price patterns, you have to read the candlesticks at all times. Especially if you are trying to get lucky in the world of trading. Here's how to read a candlestick within 1 minute that you can use:1. Observing the Shape of the Body Size of the Candlestick
If the candlestick body is large and also has a small part, then it will indicate that there is a price movement that can be considered strong. And if the tail gets smaller, then that means the candle will have enormous power.2. Memperhatikan Sumbu atau Ekor Candlestick
If you see a long tail and have a large body at the end, then it will indicate when the trade is weakening and can also make a reversal. This volatility price movement will be determined by the length of the wick.3. Reading the Body and Axis Ratio
It will be in the state of the body that is in the middle and will have two tails or axes. This position will show that there is a balance of strength among buyers and sellers. In this position it will also cause the trading market to become hesitant. The trading market in such a state of doubt will usually be more protracted when the axis or tail is getting longer and also smaller.4. Body Position
A summary of the above is the body of the candlestick which will be located at the end and will signal resistance. If the wick is above and below and the position is in the middle, then it will indicate market doubt.How to Read Candlesticks on Binomo?
Before understanding candlestick patterns on Binomo, you must understand Binomo, which is a type of binary options trading. This will have a big impact on how you trade. In Binomo, you need to determine whether the value of an asset will increase or decrease in a certain period of time.
You can choose a choice of time period starting from a few seconds. Therefore, there are many aspects that you need to do to be able to read candlestick patterns in the right way. One of them is to use several indicators that can really help you trade.
How to Read Stock Candlesticks?
As a beginner stock trader, you actually don't need to remember the terms or how to read the candlestick in the form of the pattern itself. It must also be remembered that if you want to become a professional trader, you must have your own strategy and as much as possible not make common mistakes when trading.
Only by mastering the basic theory, traders can actually analyze candlesticks in the right way. You can try to observe the price movement pattern of the candlestick. When a Downtrend occurs, the pattern of the candlestick will produce a long red body with a short wick or even no wick at all.


