 Last:
Last: 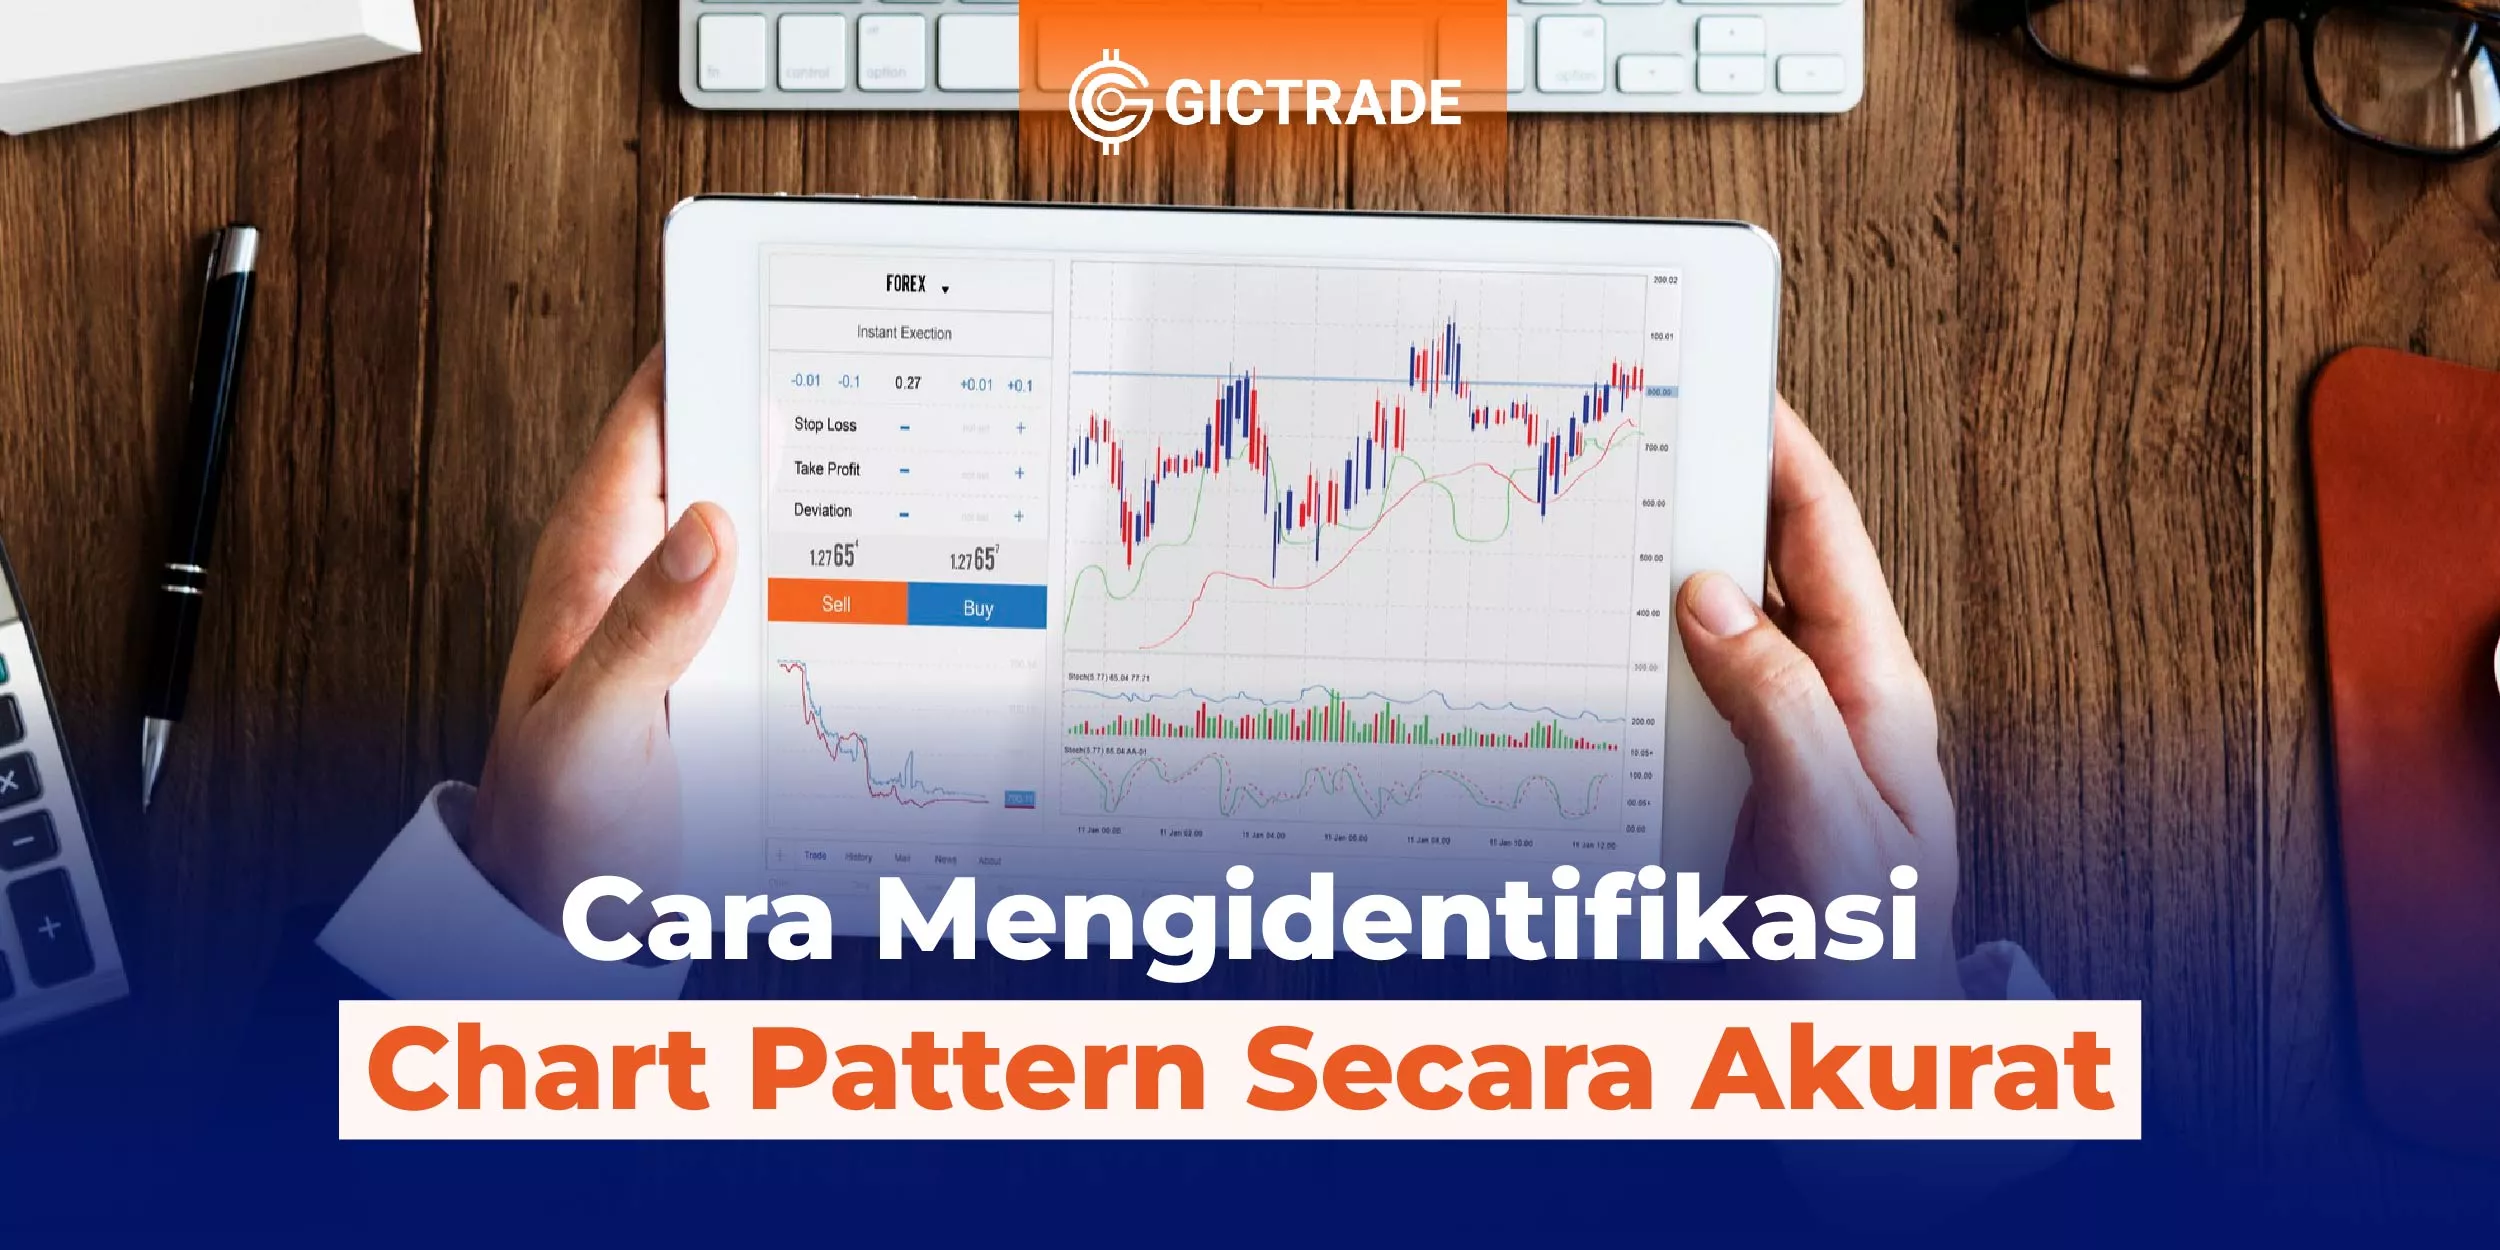
How to Identify Chart Patterns - In the world of technical analysis, identifying chart patterns is an important skill that can assist traders and investors in making better investment decisions. Chart patterns describe historical price behavior and provide clues as to the future direction of the price. By studying and identifying chart patterns, you can gain valuable insights into potential price movements of stocks, currencies, or commodities. In this article, we will discuss some of the most common and effective chart patterns, as well as provide a step-by-step guide on how to accurately identify chart patterns in Indonesian. Let's get started!
Table of Contents

Definition of Chart Pattern
Chart patterns are patterns formed by price movements in the price chart of an asset or financial instrument. Chart patterns provide an overview of price behavior and can be used to predict the direction of future price movements. In technical analysis, chart patterns are often used to identify trends, price reversals, or trend continuations.
Most Common Chart Patterns
Head and Shoulders
One of the most famous chart patterns is the "Head and Shoulders". This pattern is formed by three peaks, with the middle peak (head) being higher than the other two peaks (left and right shoulders). The Head and Shoulders pattern usually indicates a trend reversal from bullish to bearish.
Double Top and Double Bottom
"Double Top" and "Double Bottom" a pattern is formed when the price reaches a certain level twice before experiencing a trend reversal. Double Tops occur after an uptrend, while Double Bottoms occur after a downtrend. This pattern indicates that the market is difficult to cross a certain level, and the price is likely to reverse.
Triangle
Triangle pattern is formed when the price forms a triangle pattern inside the chart. There are three types of triangle patterns: symmetrical triangles, ascending triangles, and descending triangles. The Triangle pattern indicates market consolidation before significant price movements.
Cup and Handle
"Cup and Handle" pattern it consists of two main parts: the "Cup" and the "Handle". This pattern looks like a cup with a handle on the right. Cup and Handle indicates price consolidation after a strong uptrend, and is often followed by a continuation of an uptrend.
Flag and Pennant
Flag and Pennant pattern is a continuation pattern that forms after a strong price movement. The flag looks like a flag with a straight line, while the Pennant looks like a symmetrical triangle. Both of these patterns indicate a period of consolidation before further price movements in the direction of the previous trend.
How to Identify Chart Patterns
Analyzing Chart Patterns Using Trend Lines
One of the most effective ways to identify chart patterns is to use trend lines. Trend lines are used to connect price peaks or valleys in a chart. If the price forms a pattern that follows the trend line well, this could indicate a continuation of the trend or a price reversal.
Looking for Chart Pattern Confirmation
Identifying chart patterns is just the first step. It is important to look for pattern confirmations before making investment decisions. Confirmation can be found through other technical signals, such as momentum indicators or candlestick patterns.
Using Technical Indicators
The use of technical indicators can strengthen the analysis of chart patterns. Some useful indicators for identifying chart patterns include the RSI (Relative Strength Index), MACD (Moving Average Convergence Divergence), and Bollinger Bands. These indicators provide additional information about the strength of the trend, momentum, and the level of volatility of the market.
Tips and Tricks to Identify Chart Patterns Correctly
Learning from Experience and Practice
Accurately identifying chart patterns requires practice and experience. Keep studying different chart patterns and observe how they behave in different market conditions. With enough time and practice, you will become more skilled in recognizing and understanding chart patterns.
Determining Stop Loss and Take Profit
Always set the right stop loss and take profit levels when using chart patterns to make investment decisions. Stop losses help protect your capital if the price moves against your prediction, while take profits help you lock in profits when the price reaches the expected level.
Using the Appropriate Timeframe
Each chart pattern has its accuracy depending on the timeframe used. Some chart patterns can be more valid on daily timeframes, while others are more visible on smaller time frames such as 1 hour or 15 minutes. Choose a timeframe that suits your trading style and be sure to check chart patterns on different time frames to get stronger confirmation.
Reading News and Market Sentiment
It is important to follow market news and sentiment when identifying chart patterns. Economic news and events can affect price movements and change the validity of chart patterns. Always be alert to important news releases and pay attention to the market's reaction to them.
Want to Get Maximum Profit Fast? Join GICTrade Now!
Unlike other conventional brokerage firms, GIC through the GICTrade platform provides a solution for traders who do not want to be charged with high trading fees. GICTrade is a peer-to-peer trading platform that brings together traders and market makers.
So, what is special about GICTrade? As a platform that brings together traders and market makers, you as a potential customer can certainly choose between the two, namely becoming a trader or a market maker.
GICTrade's role as a transaction venue provider can minimize costs and help maximize profits for traders and market makers as well as create a fair transaction atmosphere and results.
Traders will benefit from the absence of commission fees and low swap fees and spreads due to the presence of market makers as liquidity providers. You can also join the trader community on GICtrade's Telegram to ask fellow traders directly about their trading experience.
FAQs
What is a chart pattern?
Chart patterns are patterns formed by price movements in the price chart of an asset or financial instrument.
What are the most common chart patterns?
Some of the most common chart patterns are Head and Shoulders, Double Top and Double Bottom, Triangle, Cup and Handle, and Flag and Pennant.
How to accurately identify chart patterns?
You can accurately identify chart patterns through pattern analysis, using trend lines, looking for confirmations, and utilizing technical indicators.
Do chart patterns always provide accurate signals?
Not always. Chart patterns provide accurate signals in most cases, but remain vigilant for other factors that can affect price movements.
Do I need to use technical indicators to identify chart patterns?
It is not mandatory, but technical indicators can provide additional useful information to validate chart patterns.
How long does it take to master the skill of identifying chart patterns?
The time it takes to master the skill of identifying chart patterns varies for each individual. This depends on your level of dedication, practice, and experience in analyzing the markets.
Conclusion
Accurately identifying chart patterns is a valuable skill in technical analysis. With a good understanding of commonly used patterns and using the right analysis methods, you can improve your ability to predict the direction of future price movements. Remember that identifying chart patterns is just one tool in technical analysis. It is important to always incorporate other approaches, such as fundamental analysis and risk management, to make informed investment decisions. Always practice, keep learning, and keep an eye on market changes to improve your skills in accurately identifying chart patterns.
| Also Read : Using the "Bearish Harami" Pattern to Maintain Profits |


