Hammer Pattern - In the world of trading, knowing various patterns and strategies is the key to success to achieve profitable results. One of the patterns that is important to recognize is the "Hammer" pattern. In this article, we will explore the concept of the "Hammer" pattern and how we can utilize it in our trading activities. In the process, we will learn about the meaning of the "Hammer" pattern, its characteristics, as well as practical steps to use it in making trading decisions. Let's get started!
Table of Contents
- Getting to Know the "Hammer" Pattern and Its Characteristics
- Utilizing the "Hammer" Pattern in Trading
- FAQs (Frequently Asked Questions)
- Does the "Hammer" pattern only apply in stock trading?
- How accurate is the "Hammer" pattern in predicting price reversals?
- What if the "Hammer" pattern appears after a strong price trend?
- How long does it take to master the "Hammer" pattern?
- Are there any risks associated with using the "Hammer" pattern?
- Are there any technical indicators that can be used in conjunction with the "Hammer" pattern?
- Conclusion
Getting to Know the "Hammer" Pattern and Its Characteristics
What is the "Hammer" pattern in trading?
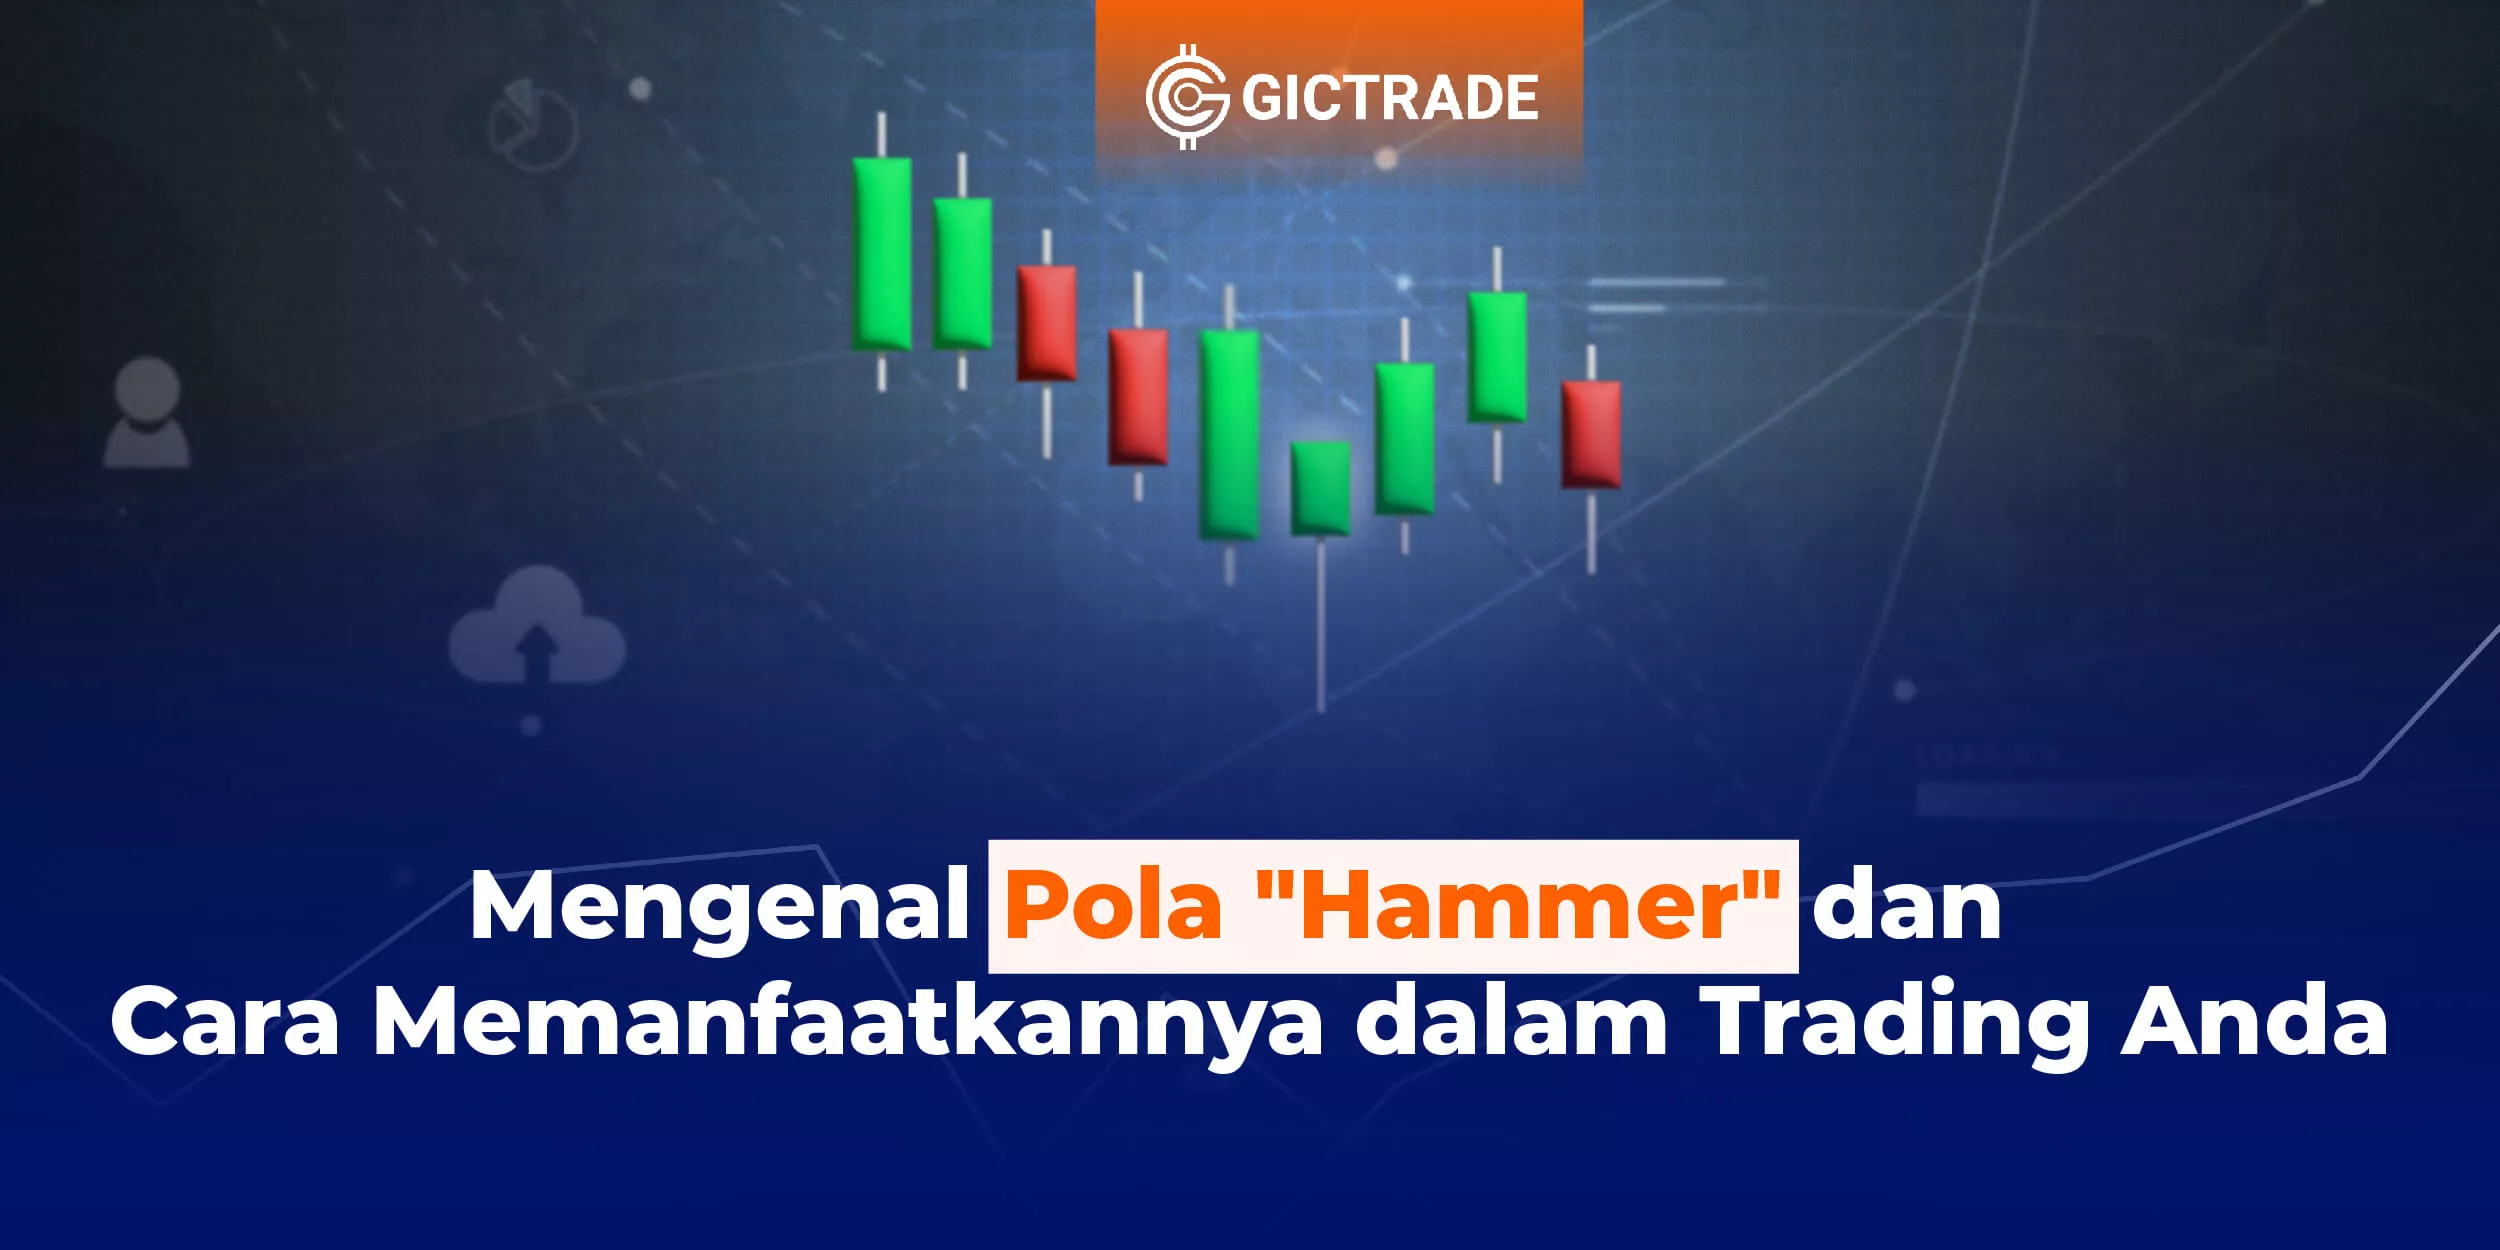
The "Hammer" pattern is one of the candlestick patterns that often occur in price charts. This pattern indicates a reversal of direction from a price decline to a potential price increase. The name "Hammer" itself comes from its shape that resembles a hammer. This pattern consists of a single candlestick with a small or short body and a longer tail at the bottom.

Characteristics of the "Hammer" pattern
- Short body: The body or body of the candlestick on the "Hammer" pattern is relatively short or small. It shows a slight difference between the opening and closing prices over a period of time.
- Long tail below: What distinguishes the "Hammer" pattern is the length of the tail at the bottom of the candlestick. This tail reflects a lower price rejection and a potential reversal of direction.
- No or short tail on top: Typically, the "Hammer" pattern does not have a long tail at the top. If there is, then the tail will be shorter compared to the tail at the bottom.
Utilizing the "Hammer" Pattern in Trading
Identify the "Hammer" pattern in the price chart
In order to take advantage of the "Hammer" pattern in trading, we first need to be able to identify the pattern in the price chart. Here are the steps to recognize the "Hammer" pattern:
- Observe the price chart: Pay attention to the price chart of your chosen trading instrument. Focus attention on the candlestick with a long tail at the bottom and a small body.
- Confirm the pattern: To confirm whether the pattern is a "Hammer" pattern or not, make sure that there is no or no short tail at the top of the candlestick.
Determining a reversal signal with a "Hammer" pattern
After identifying the "Hammer" pattern in the price chart, the next step is to determine the direction reversal signal. Here are the things to look out for:
- Confirmation of the next candlestick: To validate the reversal signal, wait until the next candlestick forms after the "Hammer" pattern. If the next candlestick moves upwards and closes above the opening price of the "Hammer" pattern, it could be a strong signal for an upward reversal.
- Trading volume: Also pay attention to the trading volume that occurs when the "Hammer" pattern appears. High volume can indicate strong market interest for a reversal.
Placing orders with the "Hammer" pattern
If we have already confirmed the "Hammer" pattern and got a strong directional reversal signal, we can consider placing an order. Here are the steps that can be followed:
- Determine the entry level: Identify the appropriate entry level based on the closing price of the next candlestick after the "Hammer" pattern. If the closing price is above the opening price of the "Hammer" pattern, the entry level can be set slightly above the closing price.
- Set a stop loss level: To manage risk, set a stop loss level below the tail low price of the "Hammer" pattern. This helps protect the position from unwanted price movements.
- Determine the target level: Set a profit target level by paying attention to resistance levels that have the potential to be an obstacle to the upward price movement.
FAQs (Frequently Asked Questions)
Does the "Hammer" pattern only apply in stock trading?
No, the "Hammer" pattern can be used in a variety of trading instruments such as stocks, forex, and commodities. The basic principle remains the same, which is to identify potential price reversals.
How accurate is the "Hammer" pattern in predicting price reversals?
The accuracy of the "Hammer" pattern cannot be measured with certainty because price movements are greatly influenced by market factors and sentiment. However, by combining the "Hammer" pattern with technical analysis and other indicators, we can increase the probability of trading success.
What if the "Hammer" pattern appears after a strong price trend?
If a "Hammer" pattern appears after a strong price trend, it could be a potential reversal signal. However, keep in mind that not all "Hammer" patterns result in successful reversals. It is important to always confirm the signal with the next candlestick and other technical indicators.
How long does it take to master the "Hammer" pattern?
The time it takes to master the "Hammer" pattern varies for each individual. With consistent practice, in-depth market analysis, and constant trading experience, we can improve our understanding and use of these patterns over time.
Are there any risks associated with using the "Hammer" pattern?
As with any trading strategy, the use of the "Hammer" pattern also involves risk. The main risk is the possibility of false signals or unsuccessful reversals. It is important to always manage risk by using stop losses and good risk management.
Are there any technical indicators that can be used in conjunction with the "Hammer" pattern?
Yes, there are several technical indicators that can be used in conjunction with the "Hammer" pattern to increase signal confirmation. An example is the RSI (Relative Strength Index) or MACD (Moving Average Convergence Divergence) indicator. These indicators help to provide a more complete picture of the potential reversal strength.
Want to Get Maximum Profit Fast? Join GICTrade Now!
Unlike other conventional brokerage firms, GIC through the GICTrade platform provides a solution for traders who do not want to be charged with high trading fees. GICTrade is a peer-to-peer trading platform that brings together traders and market makers.
So, what is special about GICTrade? As a platform that brings together traders and market makers, you as a potential customer can certainly choose between the two, namely becoming a trader or a market maker.
GICTrade's role as a transaction venue provider can minimize costs and help maximize profits for traders and market makers as well as create a fair transaction atmosphere and results.
Traders will benefit from the absence of commission fees and low swap fees and spreads due to the presence of market makers as liquidity providers. You can also join the trader community on GICtrade's Telegram to ask fellow traders directly about their trading experience.
Conclusion
In trading, getting to know the "Hammer" pattern and understanding how to take advantage of it can be advantageous for traders. This pattern provides an indication of potential price reversals that can be leveraged to make better trading decisions. However, it is important to remember that the "Hammer" pattern is not a 100% accurate signal, and its use should always be reinforced with comprehensive technical analysis.
By studying the characteristics of the "Hammer" pattern and using the right steps in identifying signals, placing orders, and managing risk, we can improve our trading success. Always practice and develop our understanding of these patterns, as deep experience and understanding are the keys to becoming a better trader.
| Also Read : How to Use the "Piercing Line" Pattern to Increase Profits |
 Last:
Last: 


