 Last:
Last: 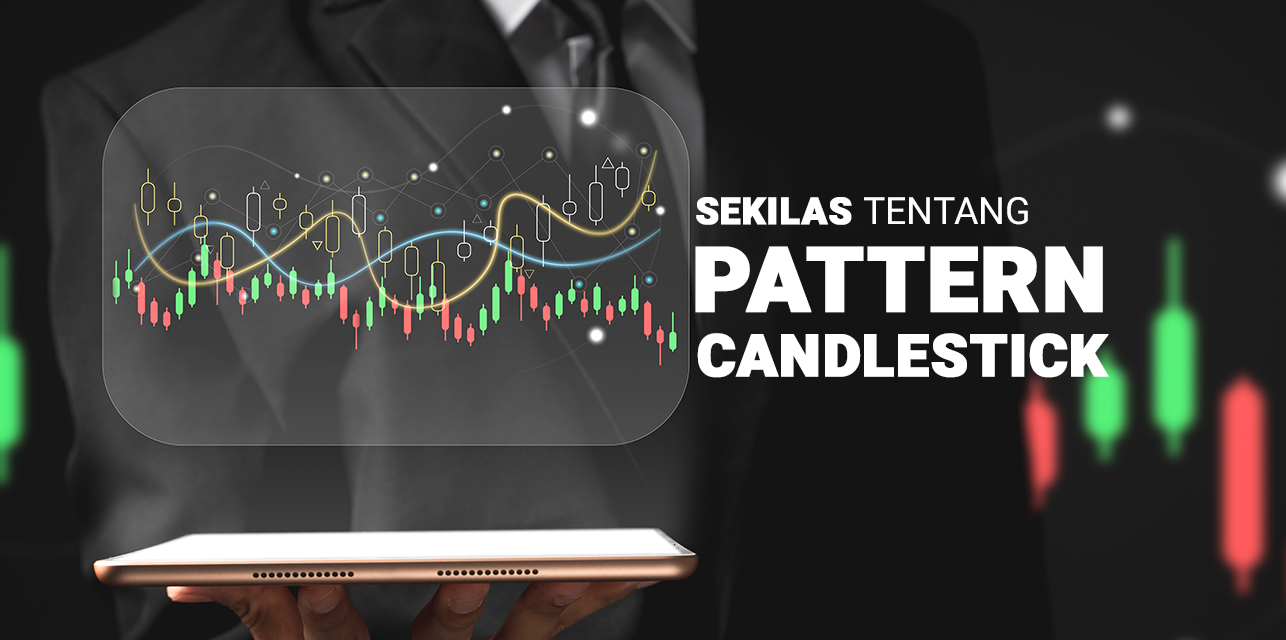
History of Candlestick Pattern
Candlestick charts are a method developed by Munehisa Honma, who was a trader of rice commodities in the 18th century in Japan. As for the person who has popularized candlestick charts in the western world, namely Steven Nison. Munehisa Honma is one of the first and most famous Japanese to use past price data to predict future price movements. He had amassed a fortune trading in a grand scheme on the rice market during the 18th century. It is mentioned that Honma has also won trades 100 times continuously. It is also rumored that the assets he has accumulated are equivalent to US$10 Billion. Honma's books on the market and its trading laws, which evolved into the candlestick charts we know today. The candlestick chart was discovered by Steve Nison when he was acquainted with a Japanese broker in 1987, and was first introduced to the western world through the book "Japanese Candlestick Charting Techniques". At this time, candlestick charts have been widely used all over the world. In fact, his writings have also been appreciated as works that have revolutionized technical analysis. Before continuing to the next discussion, it's a good idea for you to download application the GIC Mobile so that you can trade and meet the candlesticks below.What Goes Into Types of Candlestick Patterns
There are several types of patterns from the candlestick itself. Here we will learn what types of candlestick patterns themselves are included.Three Line Strike Candlestick Pattern
These three bullish lines make the three black candles in the trend go down. Each bar will indicate a lower low. Furthermore, these bars will be closed with a low intrabar. The new fourth bar will open lower but reverse.Two Black Gapping Candlestick Pattern
A bearish two black gapping will appear after an important peak in an uptrend, with a downward gap that will result in two black bars that are in lower lows.Three Black Crows Candlestick Pattern
The bearish three black crows will start near the bullish trend high, with the three black crows at the lows and the lower ones will close near the intrabar lows. The definition of this pattern is a decline that will continue at the lowest position which will later be even lower. This may trigger a downtrend on a wider scale.Evening Stars Candlestick Pattern
The bearish evening star will start with a high white bar that will take the trend up to a new high. A downward gap on the third bar will complete the pattern, which will predict that the decline will continue at lower lows, and may trigger a downtrend on a wider scale. According to Bulkowski, the pattern will predict lower prices with an accuracy rate of 72%.Abandoned Baby Candlestick Pattern
A bullish abandoned baby pattern will appear at the lowest point of the downtrend, after which a series of black candles will print lower lows. The lower market gap will occur on the next bar, but it will be the opposite of the evening stars, this time the new sellers who fail will appear. This pattern will result in a narrow range doji bar with a mold of opening and closing at the same price. After knowing the types of candlestick patterns, then you can teach your friends about this understanding. And if you want to earn extra money, you can invite friends or register as an IB in the Affiliate program from GIC.Types of Single Candlestick Patterns
There are various types of single candlestick patterns. As the name implies, a single candlestick means that it has only one candlestick in its pattern. Here we will learn about the different types of single candlestick patterns.Long Candle
As the name implies, this long candle is included in a relatively long candlestick pattern. The main benchmark for this long candle pattern is its very long body size. Not much different from the marubozu pattern, in this long candle there are also two types, namely long bullish candles and long bearish candles. The difference is that a long candle that still has a shadow will be clearly visible, unlike a marubozu that does not have a shadow at all.Marubozu
This marubozu means the bald head, so this candlestick has no wick (shadow). Marubozu will signal a signal with a strong movement seen from the side of market participants who will buy or sell. In general, this bullish candlestick will be represented by white (blank), while for a bearish candlestick it will be represented by black.Doji
This doji almost appears to have no body, and this will indicate a phenomenon of the inability of market participants both to buy and sell in holding a control. It can be said that Doji is a pattern in which the price of a commodity or stock is experiencing a consolidation. Here, market participants are expected to wait and see, and be able to observe the candlestick the next day.Spinning Tops
Spinning tops are candlesticks that have a long upper shadow and also a long lower shadow. The characteristic of this spinning top will have two shadows that extend at the top and bottom with a small body size. The body color of these spinning tops is also not very important, because the appearance of this spinning tops pattern will reflect a market doubt between the price that will move towards bullish, or bearish. This uncertainty will be the main focus in the spinning tops pattern.
Inverted Hammer & Shooting Star
Inverted Hammer and Shooting Star are the same twin brothers as Hammer and Hanging Man. The difference will only lie in the position of the body that is being reversed. Both also have a small body and also an upper shadow which will usually be about 1.5 to three times the length of the body. An inverted hammer is a bullish signal that requires confirmation of a bullish candlestick that appears afterwards. As for shooting stars, it is a bearish signal that will also require confirmation of the bearish candlestick that appears afterwards.Hammer & Hanging Man
Both will have the characteristics of a short body shape (both for black and white ones) with a long lower shadow and also a short upper shadow. The difference between a hammer and a hanging man will only lie in the location, where the hammer is always located in the valley, while for the hanging man will always be at the top. The appearance of a hammer is a sign of a bullish signal, while the appearance of a hanging man is a sign of a bearish signal.Pola Candlestick Dual
There are various types of dual candlestick patterns. As the name implies, dual candlesticks mean that there will be two candlesticks in the pattern. Here we will learn about the different types of dual candlestick patterns.Harami
In this pattern, the candlestick will be on the left side with a larger body than the right side. It is called harami because of its pregnant shape. A smaller candlestick on the right will indicate that the trend is about to change. The smaller a candlestick is on the left, the stronger the potential for a trend change.Engulfing Pattern
There are two types of engulfing patterns that you should know, namely bullish engulfing and bearish engulfing. You will see an engulfing pattern that can be recognized when there is a candlestick that will exceed the length of the previous candlestick. The low price of this bullish candlestick does not need to be lower than the bearish low price of the previous candlestick. However, this high price should be higher than the high price on the previous candlestick. The close price of this bullish candlestick should also be higher than the high price of the previous candlestick, but this does not mean that it is a must. Meanwhile, for bearish engulfing is the opposite of bullish engulfing itself.Tweezer
The tweezer will be formed with a candlestick body which can be seen from the difference between the opening and closing prices. These tweezers will usually be located above and below, which have patterns to indicate that there is a reversal of the direction of a trend, although for a broader context additional candles will usually be needed to confirm the signal. This tweezer bottom is a form of hammer that is side by side. As for the tweezer top, it is an inverted hammer (shooting star, because it is on top) which will be side by side.Dark Cloud Cover & Piercing Line
Dark cloud cover is a bearish pattern, while piercing line is a bullish pattern. The conditions of the Piercing Line pattern are that for the low price of the bullish candlestick should be lower than the low price of the previous bearish candlestick, the close price for the bullish candlestick should be higher than the close price of the previous bearish candlestick, and the length for the body of the bullish candlestick should be at least half the length of the body of the candlestick on the previous bearish.
For the Dark Cloud Cover pattern conditions, namely, the high price of the bearish candlestick must be higher than the high price of the previous bullish candlestick, the close price of the bearish candlestick must be lower than the close price of the previous bullish candlestick, the length of the bearish candlestick body must be at least half of the length of the body of the candlestick in the previous bullish.
Pola Candlestick Triple Lengkap
Lastly, there are various types of Triple candlestick patterns. As the name implies, a triple candlestick means that it will have three candlesticks in its pattern. Here we will learn about the different types of triple candlestick patterns.Three White Soldiers & Three Black Crows
The Three White Soldiers is one of the patterns that will be considered a strong bullish signal, especially if it will appear during a downtrend that enters a consolidation phase. The first candlestick in this pattern is certainly a bullish candlestick. The second candlestick will also be a bullish candlestick whose body should be longer than the first candlestick. Three black crows is a bearish pattern that will be marked by the appearance of three bearish candlesticks in a sequential manner during an uptrend. The first candlestick in this pattern is a bearish candlestick. As for the second candlestick, it must also be a bearish candlestick whose body must be longer than the first candlestick.Morning Star & Evening Star
In the Morning Star candlestick pattern, the arrangement that will appear is a bearish candle-doji-bullish candle and will occur in a downtrending chart position. This Morning Star candlestick pattern will indicate the time when it is time to carry out a bullish reversal. On the other hand, the Evening Star candlestick pattern will occur when the chart position is uptrending, and signal the time to do a sell-off (bearish reversal). The formation is a bullish candle-doji-bearish candle. On the Evening Star and Morning Star, you should check if a price reversal will occur by seeing if the third candle is able to close above the midpoint of the first candle. Before our discussion ends, you can fill out GIC's internal survey so that we can also update the system and improve the performance that we should have.Candlestick Pattern FAQ
Here are some questions that are often asked by traders regarding the candlestick pattern itself. These questions are:What is a Bullish Pattern Candlestick?
Basically, a bullish market movement will be marked by a sustained price increase. For example, on the increase in JCI or the price of a certain stock. If the candlestick has shown a bullish move, then it will indicate an entry point for a long trade. This bullish candlestick can also help predict when the trend will be bearish or will reverse upwards rebound.What is Candlestick Pattern Strategy?
Candlestick strategy is an understanding that you must do about the type of candlestick pattern itself. And to learn the different types of candlestick patterns, you must first know how to read them. There are three things that are the basis for how to read from these patterns, namely:1. Candlestick loads four price positions
- Open: the price at which the trade is open today
- Low: today's lowest price
- High: today's highest price
- Closed: the price after trading closed yesterday
2. What do red and green candlesticks mean?
When the candlestick is green, it indicates that the open price will be higher than the closed. This pattern is often referred to as a bullish candlestick. But when it is red, then it will signal a lower open price than closed (bearish candlestick).
When a candlestick is green, it will move upwards. And vice versa.
Meanwhile, there is also a candlestick or wick "wick" which is often referred to by some people as a shadow. The wick will inform you of any price fluctuations that are moving according to the duration of the candlestick itself. When the value of a commodity or forex is experiencing volatility, then its wick will be much longer than its own body.
When you see a long, downward wick, it indicates that market participants are pushing prices down, but they are not strong enough to keep prices low. At the same time, other market participants will actually make purchases until finally they can push prices up. This phenomenon is often called a bullish reversal. And vice versa.
How is the Candlestick Pattern in Binomo?
Basically, candlesticks will have the same type on each platform. So, here's how to interpret Binomo candlesticks to always be profitable. Candlestick Body Size With the body size of the Candlestick, you can get information about the strength of each side. When the candlestick is about to lengthen, the momentum increases. Meanwhile, if the body is declining, then the momentum is slower.Panjang Sumbu Candle Stick Panjang sumbu dalam grafik ini akan menunjukkan volatilitas harga pasar. Jika sumbu panjang, maka itu merupakan indikasi bahwa harga sedang bergerak cepat, aka tetapi ditolak untuk sebuah resistensi. Rasio Dari Ukuran Sumbu Dan Badan Rasio antara ukuran sumbu dan juga badan grafik candlestick harus dapat dibaca. Jika pasar sedang memiliki tren dinamis yang kuat, maka grafik akan menunjukkan ukuran batang lilin yang panjang, namun sumbunya kecil. Candlestick Wick Length The length of the wick in this chart will indicate the volatility of the market price. If the wick is long, then it is an indication that the price is moving fast, aka but it is rejected for a resistance. Ratio of Axis and Body Size The ratio between the size of the wick and the body of the candlestick chart should be readable. If the market is having a strong dynamic trend, then the chart will show the size of a long candlestick, but the wick is small.
In an uncertain market situation, the body of the candlestick will be small, but the wick will be much longer. Body Position From The Graph If you observe that the candlestick has a long wick but its body is at one end, then it means that there will be a resistance event. And vice versa, if the candlestick is in the middle of the lower wick, then market uncertainty will be indicated.
How Candlestick Patterns in Crypto?
Just like the previous discussion, for Binomo which is a trading platform while for Crypto itself is a product. Therefore, the type of candlestick itself will be the same. You have to learn it because if at any time there is a candlestick that occurs in the market, then you can respond to it well. The candlesticks that appear will also vary. It does not mean that in one platform or one product a certain candlestick will appear, but the cadlestick can appear in any type.Name 42 Candlestick Pattern?
According to its shape, there are 42 types of candlestick patterns. These types are: Candlestick Reversal Patterns Single Candle Pattern – Bullish Reversal- Southern Doji
- Southern Long-Leg Doji
- Dragonfly
- Hammer
- Inverted Hammer
- Bullish Belt Hold
- Northern Doji
- Northern Long-Leg Doji
- Gravestone
- Shooting Star
- Hanging Man
- Bearish Belt Hold
- Bullish Pregnant / Bullish Harami
- Bullish Pregnant Cross
- Bullish Homing Pigeon
- Matching Low
- Bullish Engulfing
- Piercing Line
- Tweezer Bottom
- Bearish Pregnant / Bearish Harami
- Bearish Pregnant Cross
- Bearish Homing Pigeon
- Matching High
- Bearish Engulfing
- Dark Cloud Cover
- Tweezer Top
- Morning Star
- Morning Doji Star
- Bullish Abandoned Baby
- Morning Tri Star
- Three White Soldiers
- Evening Star
- Evening Doji Star
- Bearish Abandoned Baby
- Evening Tri Star
- Three Black Crows
- Upward Gap Tasuki
- Rising Three
- Bullish Marubozu
- Downward Gap Tasuki
- Falling Three
- Bearish Marubozu


