 Last:
Last: 
Candlesticks to indicate a bearish event are very diverse. One of them is the shooting star candle which will determine the bearish reversal mode. This shooting star candle will greatly help traders to be able to analyze the current market conditions. For that, this time we will learn what the shooting star candle is.
Shooting Star Candle is a sign in bearish reversal mode. When the existing price is being pushed up but will soon fall back, a long upper shadow line will form on the chart, so that the shooting star pattern itself will be formed. For more details about the shooting star candle itself, you can read the article below. However, before reading, you can fill out GIC's internal survey to be able to provide suggestions and criticisms regarding the GIC platform itself.
What is a Shooting Star Candle?
A shooting star is a bearish candlestick with a long upper shadow, little or no lower shadow, and a small body near the low of the day. It appears after an uptrend. In other words, a shooting star is a type of candlestick that forms when a security/market opens significantly higher, but then closes the day near the open again.
In order for a candlestick to be considered a shooting star, the formation must appear during a price increase. Also, the distance between the high of the day and the open must be more than twice as large as the body of the shooting star itself. There should be little or no shadow below the real body.
In order for a candlestick to be considered a shooting star, the formation must appear during a price increase. Also, the distance between the high of the day and the open must be more than twice as large as the body of the shooting star itself. There should be little or no shadow below the real body.
This shooting star will indicate a potential high and also a reversal. The shooting star candle is most effective when it forms after a series of three or more consecutive bullish candles with higher highs. It can also occur during periods of overall price increases, even if some of the recent candles have been bearish.
Following the advance, the shooting star candle opens and then moves up strongly during the day. This would indicate buying pressure that would be similar to what was seen during the last few periods. However, as the day progresses, sellers step in and would push the price back up near the open, erasing any gains for the day.
This shows that buyers lost control at the close of the day, and sellers may have taken over. The long upper shadow would represent buyers who bought during the day but are now at a loss as prices have fallen back to the open.
The candle that forms after the shooting star is what confirms the shooting star candle. The next candle's high should remain below the high of the shooting star and then it should proceed to close below the close of the shooting star candle.
Ideally, the candle after the shooting star gap will be lower or open near the previous close and then move lower on higher volume. A day down after the shooting star candle will help confirm the price reversal and suggest that price could continue to fall. Traders may look to sell or short.
If price moves up after the shooting star, the price range of the shooting star candle may still act as resistance. For example, price may consolidate in the shooting star candle area. If price eventually continues up, then the uptrend is still intact and traders should look to buy rather than sell or short.
Before continuing to the criteria of the shooting star candle, don't forget to invite your friends to join GIC, or make yourself an IB Affiliate so you can get additional income from both of these things.
Shooting Star Candle Criteria
There are criteria for the shooting star candle itself. These criteria are:
- Shooting star candle appears after a rise and indicates that the price may start to fall.
- It is a bearish formation because the price tries to move up significantly during the day, but then sellers take over and push the price back down towards the open.
- Traders will usually wait to see what the next candle (period) will do after the shooting star candle. If the price drops during the next period, then they may then sell or short.
-
If the price rises after the shooting star candle, the formation may be a false signal or a candle marking a potential resistance area around the candle's price range.
Shooting Star Candle Example
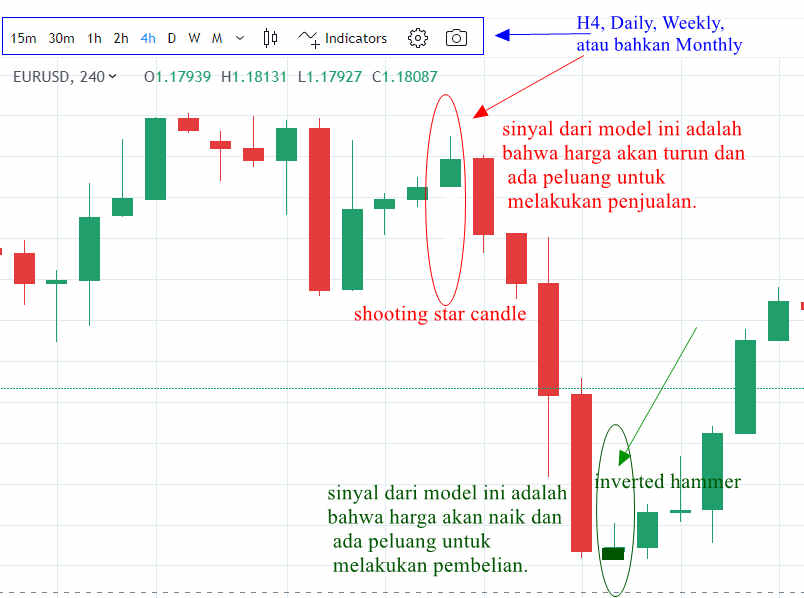
Note that the accuracy level of the shooting star candle pattern depends on several factors such as the time frame and the resistance level. So it is recommended to use a daily time frame (D1) if you are just starting to learn to trade with candlestick patterns. This is because a low time frame (below H4) is at high risk of producing noise which will actually give a fake signal.
Likewise with the line on its resistance. It is clear that the pattern can be used to inform about a reversal. Therefore, make sure that the pattern will appear when the price is approaching a resistance line. In addition, also pay attention to where the support line is to be able to determine the exit position.
The example below is a 2-minute chart of Hewlett-Packard from June 10, 2016. This image will illustrate an example of a classic shooting star candle trade.

This trading analysis begins by identifying that the price is trending up. Suddenly, a shooting star candle appears, which will be marked with a green circle on a chart. The chart above has a small candle body and a large upper wick, confirming the shape of the pattern.
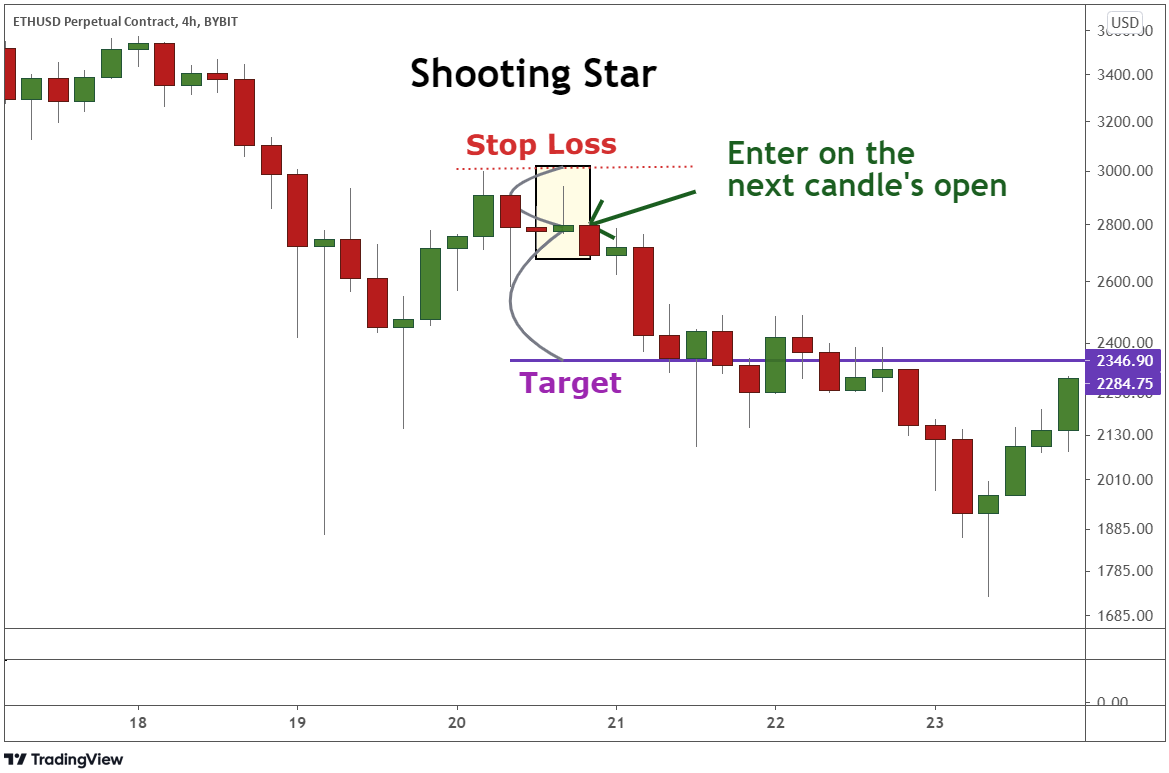
Enter
The next candle after the shooting star candle is bearish and confirms the pattern. Therefore, based on the chart, they sell the security after the confirmation of the pattern. At the same time, they will place a stop loss order above the upper wick of the shooting star candle to secure their short trade. This way, if the price makes an unexpected bullish move caused by high volatility, then we will be protected.
The maximum loss will be equal to the distance between the short HPQ level and the stop loss order level. The first blue arrow in the picture has measured the size of the candlestick. According to the shooting star candle trading strategy, you should look for a target that is three times the size of the pattern. If you have understood the example above, then you can try some theories about trading by testing them on the Preliminary Test and find out how far your trading talent is!
The maximum loss will be equal to the distance between the short HPQ level and the stop loss order level. The first blue arrow in the picture has measured the size of the candlestick. According to the shooting star candle trading strategy, you should look for a target that is three times the size of the pattern. If you have understood the example above, then you can try some theories about trading by testing them on the Preliminary Test and find out how far your trading talent is!
Inverted Shooting Star Candle
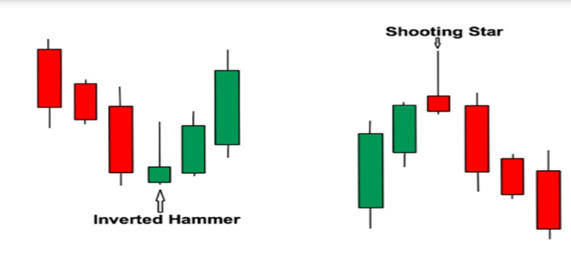
Shooting star candle has a twin brother, namely, the hammer candlestick. So shooting star and hammer are two similar candlesticks, as well as their inverted patterns. Shooting star candle vs inverted hammer actually has the same body shape, the only difference between the two candlesticks is the position of the inverted body. Both will have a small body volume, and will have a high tail shadow above.
While the tail of the shadow below it will be almost invisible/non-existent. This means that the market at the time of the inverted hammer formation is occurring, before the closing candle, the market will be pressed back by the sellers so that the value of the closing at that time is almost close to the opening direction. The function of this inverted hammer is as one of the confirmations of the price that will experience bullish (rise).
This shooting star candle will be exactly the same as an inverted hammer. Because the candle forms a very small lower body, a short lower tail, almost perfect without any tail at all. Then this candle stores a long tail above it, as a shadow line created by a trend and has a volume almost twice the size of its small body. However, both will have different implications. Where the inverted hammer candlestick shape functions as a signal of an upward trend, while the shooting star functions the opposite. See the image below; Shooting Star Peak "A" Inverted Hammer Tip "V"
Evening Star Candle
The Evening Star is a stock price chart pattern used by technical analysts to detect when a market trend is about to reverse. It is a bearish candlestick pattern consisting of three candles: a large white candlestick, a small-bodied candlestick, and a red candlestick. The evening star pattern is associated with the top of an uptrend, signaling that the uptrend is nearing its end. The opposite of the evening star is the morning star candlestick, which is seen as a bullish indicator.
The evening star candlestick pattern is considered a reliable indicator that a downtrend has begun. However, it can be difficult to distinguish amidst the noise of stock price data. To help identify it reliably, traders will often use price oscillators and trendlines to confirm whether an evening star candle is about to occur.
It is advisable to experiment with a variety of different technical indicators to predict price movements, rather than relying solely on a signal given by one. Despite its popularity among traders, the evening star candle pattern is not the only bearish indicator. Other bearish candlestick patterns include the bearish harami, dark cloud cover, shooting star, and bearish engulfing. Different traders will have their own preferences regarding which patterns to look for when looking for and detecting a change in trend.
Reverse Shooting Star Candle
The shooting star candle pattern is evidence of the law of the third movement theory. When Bull traders are in a rally to raise prices, the continuity of the trend will be influenced by the strength of the seller's reaction. The strength of the reaction will be determined by the size of a volume. If the buyer's volume at that time is still greater than the seller's volume, the rally will continue.
However, if the volume of short positions (selling) is suddenly greater, then be prepared to be able to catch the reversal signal. Signs of reversal will begin to appear when the candlestick is showing a closing price that is not far from the opening while the high price has left the candlestick body far. At that moment, the purchasing power of the bulls has reached a point of resistance and can no longer withstand the strength of the seller's reaction.
Thus, a pattern of shooting star candles is formed. The length of the upper shadow must be longer than the body of the shooting star and as much as possible not to have a lower shadow (or much shorter than the body itself).
Morning Star Candle
Morning star candle is a visual pattern consisting of three candlesticks that will be interpreted as an uptrend by technical analysts. This morning star candle is formed by following a downtrend and it indicates the beginning of an upward climb. This is a sign of a reversal of the previous price trend. Traders should pay attention to the formation of the morning star candle and then look for confirmation that the reversal is indeed happening using an additional indicator.
Morning star candle is a visual pattern, so there is no special calculation to be done. Morning star candle is a three-candle pattern with the lowest point on the second candle. However, the lowest point will only be seen after the close of the third candle. Morning star candle is a three-candle pattern with the lowest point on the second candle. However, the lowest point will only be seen after the close of the third candle. Other technical indicators can help predict if a Morning star candle is formed, such as whether the price action will approach the support zone or whether the relative strength indicator (RSI) will indicate that the stock or commodity is oversold.
Here is what the morning star candle pattern looks like:
The chart above has been shown in black and white, but red and green have become more common visualizations for candles. The important thing to note about the morning star candle is that the middle candle can be either black or white (or red or green) as buyers and sellers begin to balance out during the session.
Advantages and Benefits of Shooting Star
Shooting star candle forex with a simple form will make it easier for traders to read market patterns quickly. Can see the strength of the price trend up to the weakening of the market itself. Because at that time, traders will usually prepare to execute a sell. Moreover, assisted by other supporting indicators, this theory will be suitable for those of you who are beginner traders. Of the many traders who have applied this shooting star theory, the stop loss area is not too wide, because the candle shape of the shooting star will mean a fairly accurate resistance.
Shooting Star Advantages
- For beginner traders, Shooting Star is a very good tool because it is very simple. If traders can follow the description of the model above, then it can be found that this Shooting Star is very simple.
- The pattern itself is sometimes not very perfect. However, if this Shooting Star appears near a resistance line or trend, then the bearish tendency can be further confirmed. This is the only thing that is not important in a candle on a market trend.
- When using this mode, risk management becomes very important. Risk management does not provide traders with a “safety net” to prevent the occurrence of opposite trends in the market.
Shooting Star Advantages
- Easy to identify.
- If all these criteria are met, then it can be relied upon.
- Suitable but not limited to novice traders.
After knowing about the advantages and benefits of this shooting star candle, you can download the GICTrade application on the Play Store or App Store to be able to trade with GIC.
How to Read Shooting Star Candle
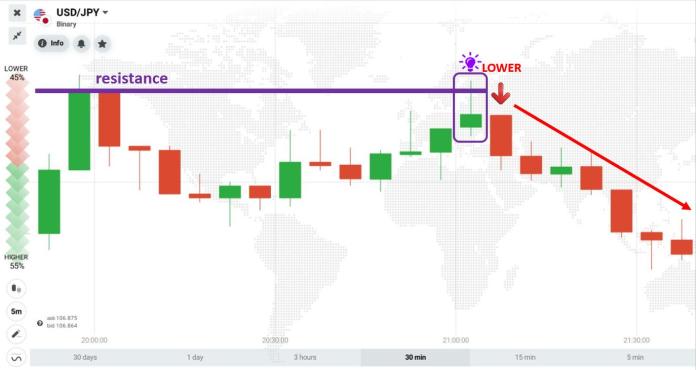
How to trade with this shooting star candle is very easy. As mentioned earlier, this shooting star candle appears when the market is bullish and is a signal of a price reversal to bearish. Therefore, this shooting star pattern can be a reference for making a sell entry. On the chart, the trading instrument will move up, then a shooting star pattern (red area) appears at the end of the trend.
This could indicate that there is a high possibility of a price reversal to go bearish. Then pay attention to the next candle. If the next candle is bearish, then it is a confirmation that the price will experience a decline and you can prepare to make a sell entry. You can start entering the market if at the opening price on the next candle.
The stop loss distance can be placed above the upper shadow of the shooting star candle. Meanwhile, we can target the profit to be twice the stop loss distance. After knowing about this shooting star candle, what are the advantages, and how to work and read it, then later if you encounter this shooting star candlestick, you can immediately take action in trading itself. Don't forget to also study other candlesticks to better understand when facing a chart on the market.
In addition, also learn each criterion of each candlestick so that you better understand other types of candlesticks. Don't forget to fill out the Trader Assessment to be able to ask anything about trading or how to do it.


