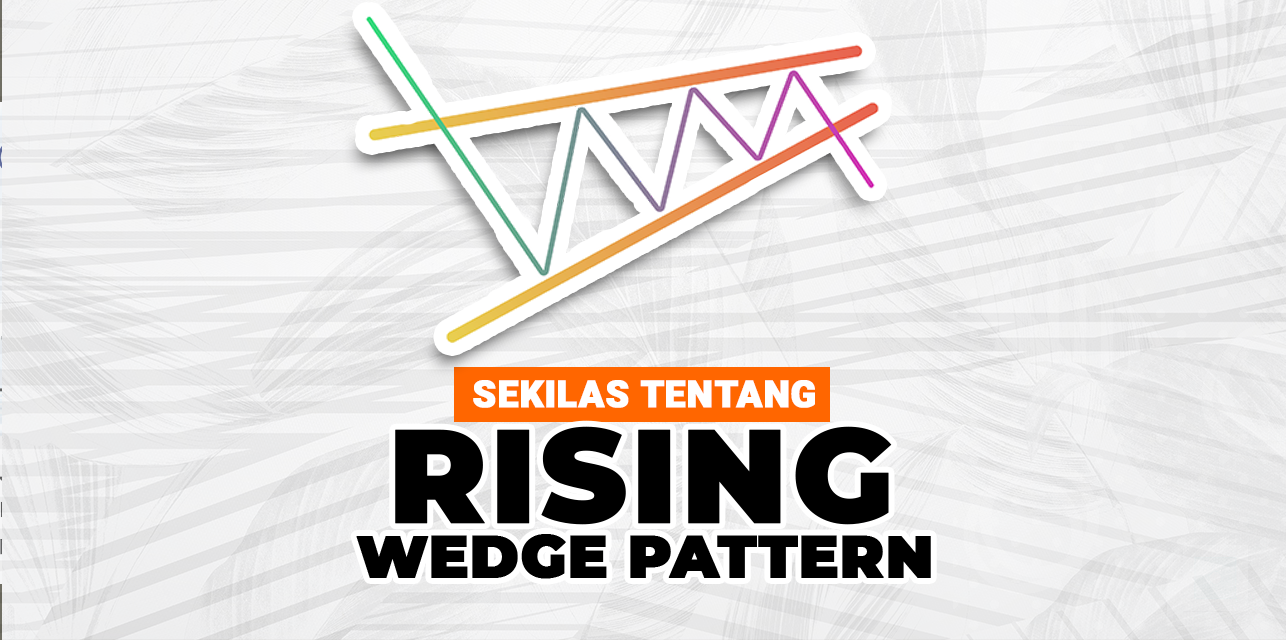
There are many patterns that we have discussed before. However, there are still some that have not been discussed before. One of them is the Rising Wedge Pattern. So this time we will discuss the pattern itself. This rising wedge pattern is widely used and found by traders in the trading world. So what is a rising wedge pattern? This rising wedge pattern is a converging trend line that is widely used in technical analysis as an indicator to see the potential for price reversals in a financial asset. This wedge pattern is usually formed based on the price of the asset in a certain period. For more details about this rising wedge pattern, you can read the article we are discussing this time. However, first make sure you have filled out the Trader Assessment so you can consult your trading with the GIC team!
What is Rising Wedge Pattern?
Rising Wedge Pattern Criteria
Here are the criteria of the rising wedge pattern itself. The criteria are:- This wedge pattern will usually be marked by converging trendlines that last for 10 to 50 trading periods.
- The pattern can be considered as a rising or falling wedge depending on its direction.
- These patterns will have an incredibly good track record of being able to predict price reversals.
- When the breakout is in the opposite direction to this wedge, it will be more accurate.
- The steeper the slice, the more accurate the signal it can provide.
Before we move on to the rising wedge pattern example, please take a moment to complete GIC’s internal survey and rate our platform’s performance on the survey.
Rising Wedge Pattern Example
The rising wedge is a technical indicator, which shows a reversal pattern and is often seen in bear markets. It appears on a chart when price is moving up with pivot highs and lows converging towards a point known as the apex. Using two trendlines—one drawn across two or more pivot highs and one connecting two or more pivot lows—the convergence is clearly visible in the upper right portion of the chart below.
:max_bytes(150000):strip_icc():format(webp)/dotdash_Final_Tales_From_the_Trenches_The_Rising_Wedge_Breakdown_Dec_2020-01-2693ed6a23b8425ab7c5af77fc1a63d8.jpg)
The rising wedge can be one of the most difficult chart patterns to recognize and trade accurately. Although it is a consolidation formation, the loss of upside momentum on each successive high gives the pattern a bearish bias. However, the series of higher highs and higher lows make the trend inherently bullish. The final break of support suggests that supply forces have finally won out and lower prices are likely to follow. There is no technical measurement to predict a decline – other aspects of technical analysis must be used to estimate a price target.

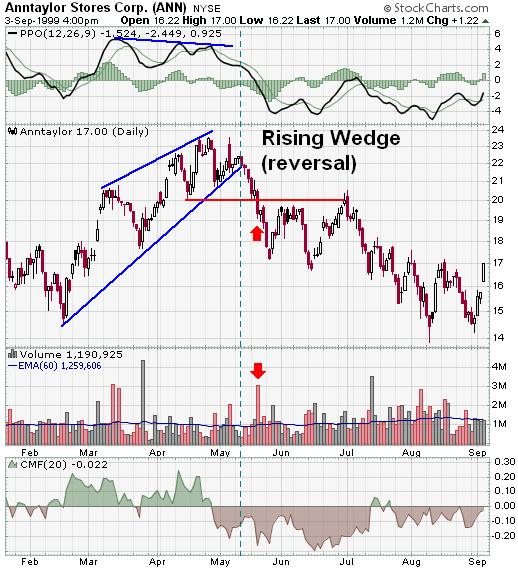
This ANN market provides a good example of a rising wedge as a reversal pattern that forms in the face of weakening momentum and money flows.
- Previous Trends: From a low of around 10 in Oct-98, ANN topped 23 in less than 7 months. The last leg up was a sharp advance from below 15 in Feb to 23.5 in mid-April.
- Upper Resistance Line: The upper resistance line is formed by three consecutive higher peaks.
- Lower Support Line: The lower support line is formed with three consecutive higher lows.
- Contraction: The upper resistance line and lower support line meet as the pattern matures. Visual assessment confirms that the slope of the lower support line is steeper than the upper resistance line. The lower slope of the upper resistance line indicates that momentum is waning as the stock makes new highs.
- Support Break: The stock hugged the support line for over a week before finally breaking out with a sharp decline. The previous reaction low was broken a few days later with a long black candlestick (red arrow).
- Volume: Chaikin Money Flow turned negative in late April and was well below -10% when the support line was broken. There was an expansion in volume when the previous low reaction was broken.
- Support from the April reaction low around 20 turned into resistance and the stock tested this level in early July before dropping further.
Rising Wedge Type
This rising wedge pattern is a category of continuation and reversal chart patterns, therefore there are two types of rising wedges, namely:
Rising Wedge – Reversal
Formed when the trend is bullish, then the price will consolidate and form a rising wedge pattern, then the price trend will reverse direction by becoming bearish.Rising Wedge – Continuation
Formed when the price trend is in a bearish state, then it will experience consolidation and form a rising wedge pattern and then the price will go back down to continue the previous trend. There are three characteristics of a rising wedge that you need to know, namely a rising wedge that has 2 resistance points, a cone-shaped rising wedge (not precise), and a rising wedge that has quite high accuracy. However, even though this rising wedge has a fairly high level of accuracy, this rising wedge pattern is one of the patterns that is difficult to recognize accurately.
This is because even though the rising wedge chart formation provides an overview of price consolidation, the absence of upside momentum at each high point will make this chart pattern biased towards a bearish trend. After discussing the types of rising wedges, also know that you can join the GIC Trading Competition by downloading the GICTrade application on the App Store or Play Store.
Rising Wedge Pattern Breakout
This usually occurs when the price of a security has been rising over time, but can also occur in the midst of a downtrend as well. Trendlines drawn above and below the price chart pattern can converge to help a trader or analyst anticipate a breakout reversal. While price can break out of either trendline, the wedge pattern tends to break out in the opposite direction of the trendline.
Therefore, this rising wedge pattern indicates a potential for a larger price decline after breaking through the lower trendline. Traders can enter a bearish trade after the breakout by selling the security short or using derivatives such as futures or options, depending on the security being charted. This trade will seek to profit from the potential price decline.
Rising Wedge Pattern Bullish
When a security's price has been falling over time, a wedge pattern can occur just as the trend is making its final down move. Trendlines drawn above the highs and below the lows of a price chart pattern can converge at a time when the price decline is losing momentum and buyers step in to slow the decline. Before the lines converge, the price may break above the upper trendline.
:max_bytes(150000):strip_icc():format(webp)/dotdash_Final_Wedge_May_2020-02-67d7156b6b40435584b05b73f969181c.jpg)
When price is breaking above the upper trendline, the security is expected to reverse and trend higher. Traders who identify this bullish reversal signal want to look for trades that benefit from the rising price of the security.
Rising Flag Pattern
The Rising Flag (or Bullish Flag) pattern will look like a flag with a pole. It forms when the price increase is going through a period of consolidation, and the price is moving in a narrow range defined by parallel lines. After the consolidation, the previous trend continues. This type of formation occurs when the price of a security is expected to move in an upward trendline, but some volatility along the way will create a period of consolidation.
Once price has broken the upper limit of the pattern, day traders and swing traders should trade with the UP trend. Consider buying a security or call option on the breakout entry price/point that is moving up. To identify the exit, calculate the target price by adding the initial increase amount to the breakout price. The breakout price level for the Bullish Flag pattern is the last point that will touch the upper line. When trading, wait for a confirmation move, which is when price rises above the Breakout level. To limit potential losses when price suddenly moves in the wrong direction, consider placing a stop order to sell at or below the breakout price.
Rising Wedge Pattern Target
- Identify the wedge on the chart. Draw trendlines along the swing highs and swing lows to highlight the pattern.
- Watch for the breakout. This means the price moved outside the wedge pattern that was drawn.
- Confirm the breakout. Verify that price has moved outside of the wedge. Check the trendlines to make sure you have drawn them the way you intended (usually, they will be drawn together, and connect, swing highs and lows).
- Enter a trade. You can open a buy position if the price has crossed above the upper trendline of the descending wedge, or a sell position when the price has fallen below the lower trendline of the ascending wedge. After the price has broken out, it will sometimes come back to retest the old trendline of the wedge. This can provide another entry opportunity.
- Set a stop-loss order for the trade. Some traders prefer to place their stop-loss just beyond the opposite side of the wedge from the breakout. Others may place the stop loss closer to keep the stop-loss size smaller. Risk management is an important element of any trade.
- Set a profit target or choose how you will exit a profitable position. An approximate profit target might be the height of the wedge at its thickest point, added to the breakout/entry point.
- Trailing stop-losses can also be used. If price action moves in your favor, the stop loss trails behind the price to help lock in profits.
- Consider the risk/reward ratio before proceeding. Once you have established your entry, stop-loss, and target, consider the potential reward that the trade offers. Ideally, the potential reward should be twice the risk. For example, if the profit target is 1000 pips above the entry, then ideally, the difference between the stop-loss (risk) and the entry should be 500 pips or less. If the potential reward is less than the risk, it will be harder to make money on many trades, as the losses will outweigh the wins.
Advantages and Advantages of Rising Wedge
- Easy to find on forex charts on small time frames such as M15, M30, H1 and H4.
- Can help in analyzing a situation regarding the direction of market movement.
- Easy to apply simultaneously with other supporting indicators.
- It is easy to identify trends in a price.
- The formation of a wedge pattern can make it easier for traders to know more clearly where the support and resistance areas are.
- More measurable in determining the stop loss and take profit areas. Because the pattern can be used as a clear limit on your risk.
How to Read Rising Wedge Pattern
Next, buyers start pushing the price higher, which causes a rising wedge pattern. Then, a breakdown occurs, which is caused by buyers not being able to take advantage of the positive momentum they have. This pattern then becomes a little narrower because the two trend lines will meet quite quickly. After knowing this Rising Wedge Pattern, you can identify the pattern in the chart patterns in the capital market.
Make sure you implement this trade properly and correctly so you can maximize your profits too. Don't forget to register as an IB or invite friends to join GIC and get additional income from this GIC Affiliate program. You also need to remember the criteria of the Rising Wedge Pattern so that you can more easily recognize this pattern yourself. Also create a good trading plan to get consistent profits. For those of you who want to measure your trading talent, do the Preliminary Test from GIC so you can find out more about the trading knowledge.
 Last:
Last: 


