 Last:
Last: 
Table of Contents
What is Bullish Continuation Pattern
The underlying idea of continuation patterns is that the probability of a trend continuing in the same direction is higher than the probability of a reversal. For example, buyers control the price action during an uptrend i.e. a series of higher highs and higher lows. Therefore, the party that has been in control so far has a higher chance of winning the upcoming match than the party that has been on the losing side. After a strong move to one of the two sides, the price action starts moving sideways i.e. in a temporary pause. This period ends after a confirmed breakout in the direction of the previous trend. We divide continuation patterns into bullish and bearish continuation formations. Bullish continuation patterns occur when the price action consolidates in a certain pattern after a strong uptrend. The continuation of the trend is guaranteed after the price action breaks out of the consolidation phase in an explosive breakout in the same direction as the prevailing trend.

If a breakout occurs, but the price action reverses afterward and returns to the inside of the rectangle, pennant, flag, or triangle, we have recorded a failure to continue in the same direction, hence the term “failed breakout.” For this reason, it is important to follow the following list of steps to minimize the chances of getting on the wrong side of a trade.
- Strong trend - In order for a continuation pattern to be activated, a strong trend must first be identified.
- Temporary breaks - As described above, these breaks can take many forms, but the most popular are flags, pennants, rectangles, and triangles.
-
Breakout - Arguably the most important feature of a pattern. Without a strong breakout in the same direction as the prevailing trend, the continuation pattern is not activated. It also helps us determine entry, take profit and stop loss.
How to Read Bullish Continuation Pattern
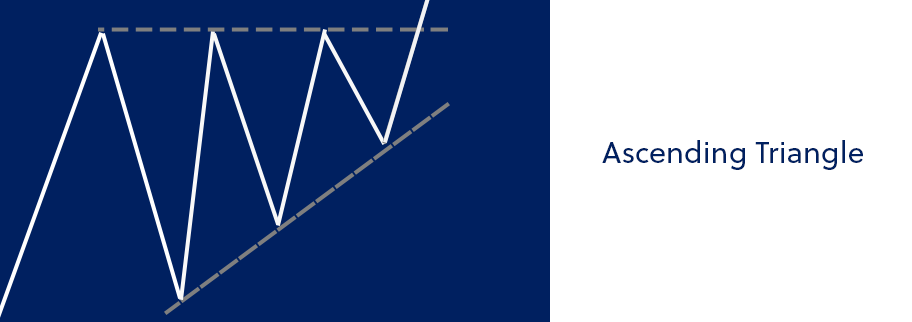
Here are some ways to read from the bullish continuation pattern. You can understand how to read it below.Ascending Triangle – Bullish Continuation Pattern:
The Ascending Triangle is one of the most reliable bullish continuation or accumulation patterns. It is characterized by a series of higher lows that fail at a flat top – this means the pattern is ‘terminal’ – eventually price must stop carving higher lows, or more often than not, the top must break.
Just like the reversal patterns discussed in the previous section, a buy signal occurs when the top is broken and the pattern is confirmed.
Descending Triangle – Bearish Continuation Pattern:
The Descending Triangle on the other hand, is a very reliable bearish continuation pattern. It is characterized by a series of lower highs that meet a flat bottom.
Traders will enter short when the flat bottom is taken. As we discussed in the Trend Trading section, prices can fall quite quickly in a bear market – this pattern often results in an impressive move lower.
Bull Flag – Bullish Continuation Pattern:
Bull Flags or Pennants are very reliable bullish continuation patterns. They deceive novice traders because prices temporarily trend down, but at a relatively shallow pace. Bullish flags are characterized by a series of parallel lower highs and lower lows in a dominant uptrend:
A buy signal is triggered when the upper parallel is violated.
Characteristics of Bullish Continuation Pattern
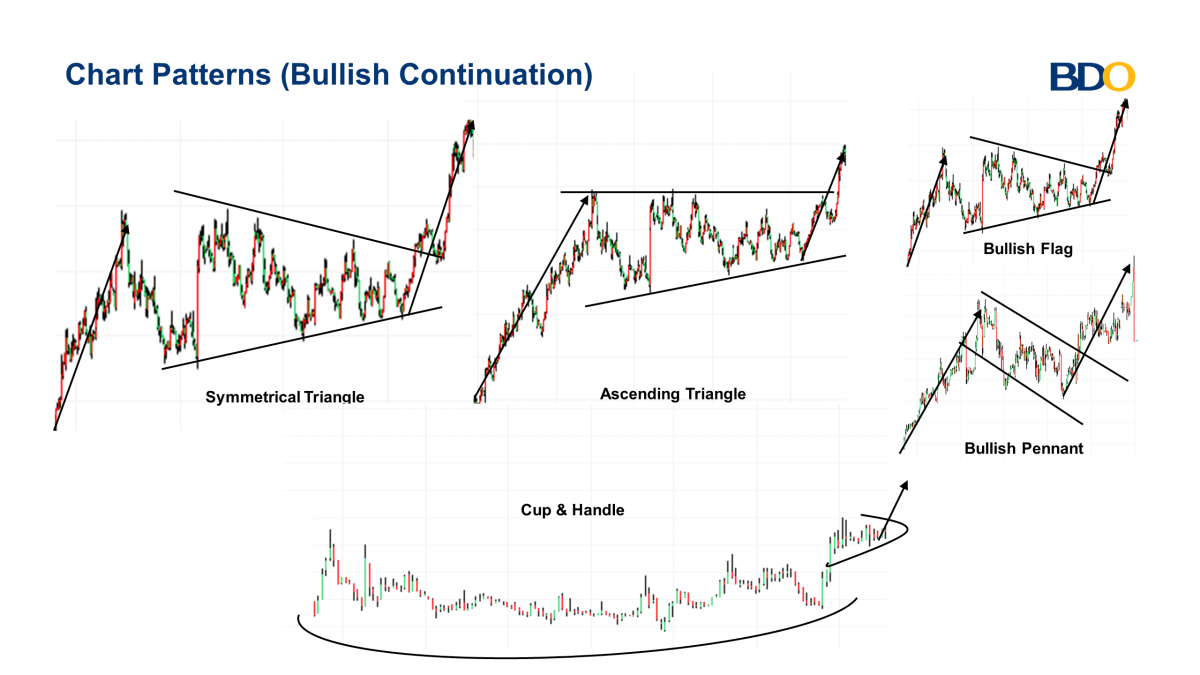
There are five major bullish continuation patterns seen above. As you can see, price starts with appreciation, then has a consolidation phase, then a breakout phase. Below you can see more about the five bullish continuations above.
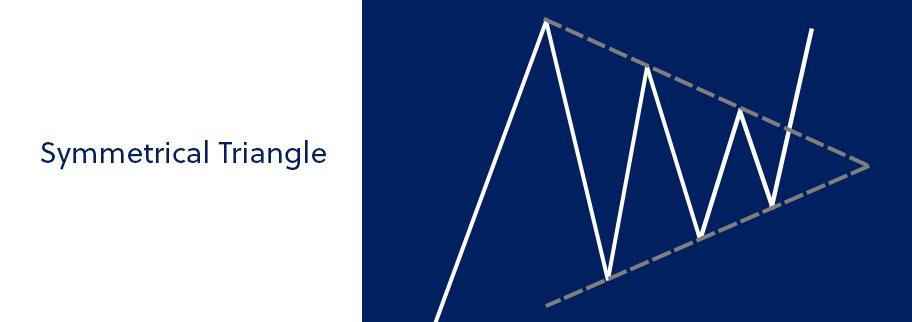
The symmetrical triangle above is a bullish continuation pattern where the slopes of the triangle are the same or nearly the same. The slopes meet at one point and the symmetrical triangle above is a continuation pattern because it started with an uptrend and ended with an uptrend.
The pattern above shows an ascending descending triangle. A descending triangle includes a flat line at the top connecting the peaks and a sloped line connecting the troughs (throughs).
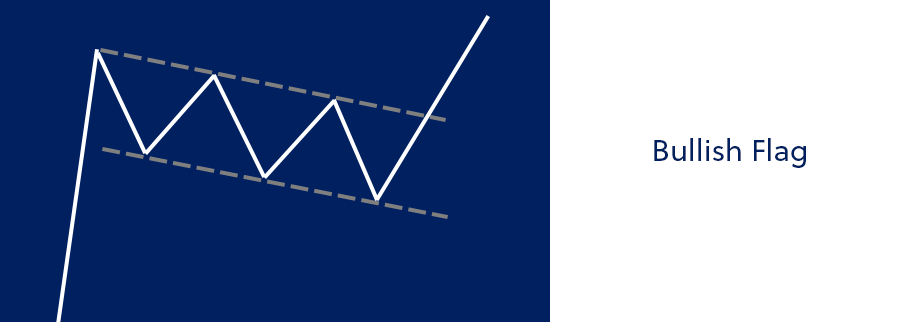
The bullish flag pattern includes a steep uptrend (known as a pole flag) followed by a slight downtrend channel. The flag pattern above ends with an uptrend in price that confirms the bullish pattern.
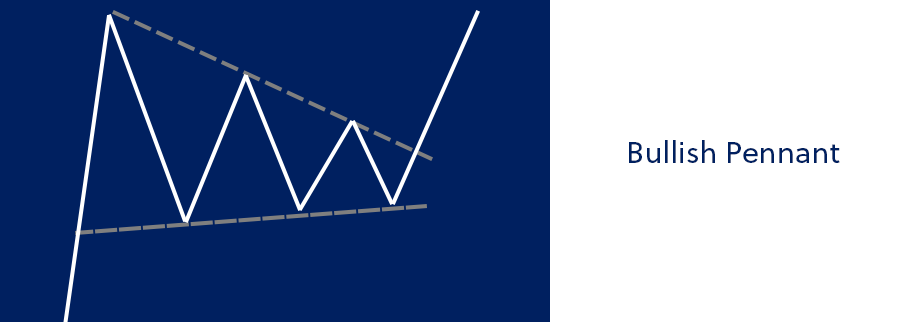
Similar to the bullish flag, the bullish pennant begins with a pole flag (a steep uptrend in price). The difference between a bullish flag and a bullish pennant is that a bullish pennant has two converging lines while a bullish flag includes parallel lines that create a channel.
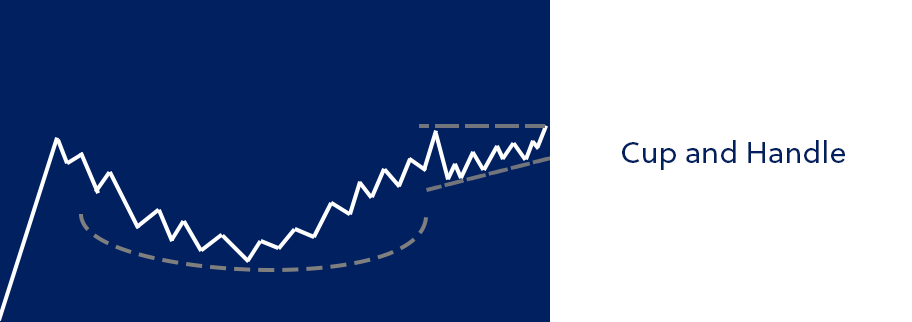
The cup and handle begins with an uptrend in price followed by a longer consolidation phase. The consolidation phase is then followed by an uptrend and then a shorter consolidation phase followed by another breakout.
also read :
|
Pola Candlestick Lengkap: Bullish, Bearish, dan Pola Continuation |
Requirements for a Bullish Continuation Pattern
Here are some requirements or characteristics of each type of bullish continuation pattern. The characteristics of each type are:Pennant Pattern
What is referred to as technical analysis, is a continuation pattern that is seen when a security experiences a large move up or down, followed by a period of consolidation, before then moving in the same direction.Main Characteristics
When looking at a pennant pattern, one will identify three distinct phases: Phase 1 – First Pole Flag The first pole flag forms the pennant pattern. The pole flag is the initial strong move up or down. Phase 2 – Pennant Pattern The pennant pattern, which is a period of consolidation between two converging trendlines, forms the pennant shape. Phase 3 – Second Pole Flag The second pole flag is the breakout of the pennant pattern in the same direction as the first pole flag.Bull Flag
Identifying a bull flag formation in real-time provides an edge in the market, especially for crypto traders. This is because it helps identify areas where corrective action occurs before the previous trend resumes. However, first, we need to know the key features to look for when trading a bullish flag pattern. This chart pattern should include prior momentum, usually represented by consecutive bullish bars up to the upside. Later, the corrective action should be in the form of consolidation. Typically, price corrections can be framed in downtrend channels, pennants, triangles, or side action. The third stage of a bullish flag pattern is the flag breakout, which provides an ideal entry signal. The initial profit target of a bullish flag pattern will be around the previous swing high, and a stop-loss order can be placed below the consolidation structure. Additionally, the bullish flag profit target can be determined by measuring the price distance between the base of the flag pole and the flag’s high. To accurately determine your profit target, you need to project a measured move to the upside starting from the breakout point.
Ascending Triangle
- Bullish Pattern – the ascending triangle is considered bullish, meaning traders will look to initiate long positions once it breaks through the upper resistance level.
- Continuation Patterns – ascending triangles are generally continuation patterns, meaning that their predictive properties are most effective when a stock is continuing an uptrend.
- Timeframe – Ascending triangles can be used on multiple timeframes. They may be on intraday charts, hourly charts, daily charts, and weekly charts.

Example of a Bullish Continuation Pattern
Trading Bullish Pennant Pattern
Traders will typically set a buy limit order at the upper trendline. On a breakout of the upper trendline, traders will first look for above-average volume to help confirm the pennant pattern breakout. A target sell order will then be set at the height of the initial pole flag plus the breakout price. In terms of risk management, a stop loss will generally be placed just below the lower trendline.
For example, assume the first pole flag moves from $10 to $20, forms a pennant through consolidation around $16, and exits the pennant at $18. The entry price is $18, and the ideal exit price is $28 ($18 + $10).

Benefits of Using Bullish Continuation Pattern
Continuation patterns help us format our trades. You may be confident that price action will continue in the same direction after a temporary pause, however, continuation patterns help us identify the right entry, take profit, and stop loss. The stronger the trend before the pause, the stronger the breakout. It is also important to note that not all continuation patterns will result in the same trend extension. Nothing is completely certain in trading and you will witness many patterns that look like continuations, but end up as reversal formations. If the trend reverses and exits the consolidation phase without breaking out in the same direction as the overall trend, our pattern is in draft mode and it is never activated. Therefore, the failure to move in the same direction is also the biggest limitation of this type of pattern. For this reason, it is important to consult other technical indicators to ensure that multiple sources indicate that the trend is likely to resume soon.
After learning about the Bullish Continuation Pattern, you can distinguish each type of bullish continuation itself. Don't forget to register at GIC and enjoy the advantages of our platform!Register Here To Get Maximum Trading Profit, Make It A Profit Opportunity!


