 Last:
Last: 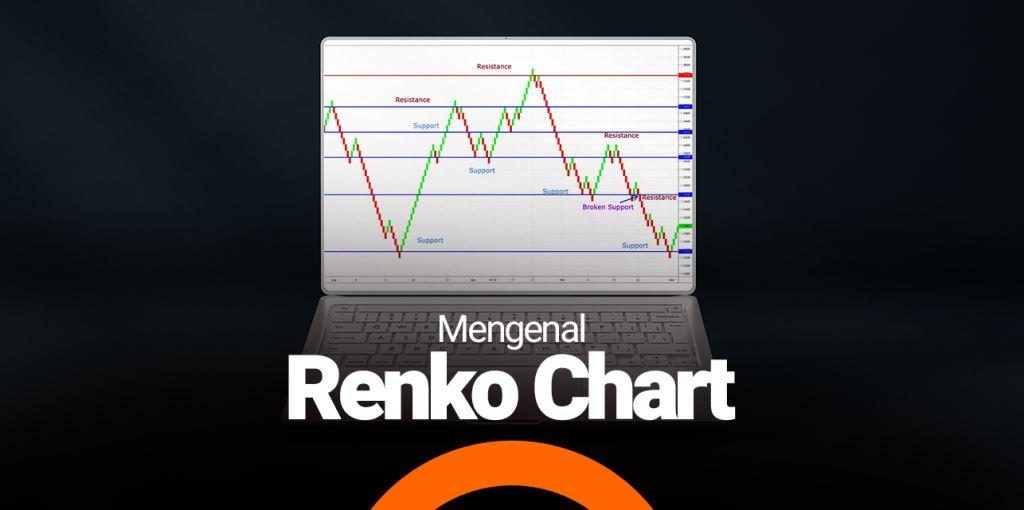
What is Renko Chart?
Renko Chart comes from the Japanese word "renga" which means "brick box". Renko Chart is a price movement chart that is formed not based on a certain time period, but based on points that you can set yourself. This Renko Chart is easier to use when analyzing market price movements because the breakouts that are formed are more clearly visible and the patterns that are formed are easier to read for those of you who often trade using price movement patterns. This Renko Chart is becoming more popular because of its unique appearance which is neat and minimalist, making it easier to analyze technically. When the price moves to a certain amount, a new brick will appear and each block is at a 45 degree angle (down or up) to the previous brick. Usually, the top brick is green or white, while the bottom brick is red or black. This renko chart will help traders to see the trend more clearly. In addition, the size of the box on the renko chart is based on the Average True Range (ATR) such as $ 0, 10, 50, 5, and so on. This renko chart has a time axis, but the time scale is not fixed. If on the candlestick chart each bar appears depending on its time frame, it is different from renko where the frequency of each bar does not depend on time, but purely on pips. This means that the variables used to set the frequency of bar appearance depend entirely on the modification of pip movements. Renko charts are made to make it easier for traders to focus on important trends because they are made by filtering small price movements. In addition, renko charts are very effective in identifying support and resistance levels because there is much less noise than candlestick charts.How to Install Renko Chart on Metatrader 4
Renko Charts Indicator for MT4 is a Metatrader 4 (MT4) indicator that has a function or core of this technical indicator is to change the accumulated historical data. The renko chart indicator on MT4 provides an opportunity to detect various oddities and patterns in price dynamics that are invisible to the naked eye. To install a renko chart on metatrader 4, there are ways you can follow, namely:- Download renko chart indicator for MT4.mq4
- Then copy the renko charts indicator for MT4.mq4 to your metatrader directory/ expert/ indicators.
- Next, you can restart or restart your MetaTrader 4.
- Select the chart and timeframe on which you want to test your MT4 indicators.
- Look for "custom indicators" in your navigator menu on your metatrader 4.
- Next right click on renko chart for MT4.mq4
- Attach to chart
- Change settings or press ok
- The renko charts indicator for metatrader 4 is now available on your chart.
How to Use Renko Charts for MT4
Renko Charts plot price action regardless of the period covered. As such, the bricks on the Renko Chart will not correlate with the Japanese candlesticks on the main price chart. Some traders who use Renko Charts completely ignore the Japanese candlesticks and base their decisions solely on the Renko Charts. They will even minimize the actual price chart and only look at the Renko Chart. The color changes and shifts in direction of the Renko Chart bricks will indicate momentum or trend reversals. As such, traders can decide to buy whenever the Renko Chart starts plotting blue bars and sell on red bars. Traders can also choose to enter a trade based on a predetermined number of bricks moving in the same direction. There is a buy setup that you can apply, namely to enter, you can wait until price reverses and the Renko Chart forms three blue bricks. Determine the price that corresponds to the high of the third blue brick and set a buy stop order at that price level. Set a stop loss at the price that corresponds to the low of the three bricks behind the possible entry point. As for the right exit time is, when the stop loss trail is at a price that corresponds to the third brick behind the current Renko Charts brick. Let the price reach the trailing stop loss when in profit. For sell settings, you can also apply it when entering, namely, you can wait until the price reverses direction and the Renko Charts forms three red bricks. Determine the price that corresponds to the lowest price of the third red brick and set a stop sell order at that price level. Set the stop loss at a price that corresponds to the height of the brick three bricks behind the possible entry point. As for the time to exit when the stop loss trail is at a price that corresponds to the third brick behind the current Renko Charts brick. Let the price reach the trailing stop loss when in profit.How to Install Renko Chart on Metatrader 5
Indicators for MetaTrader 5 is metatrader 5 (MT5) which has indicators and the essence of technical indicators is to change the accumulated historical data. Indicators for metatrader 5 will provide an opportunity to detect various oddities and patterns in price dynamics that are invisible to the naked eye. To install renko charts on metatrader 5, there are ways you can follow, namely:- Download renko - indicator for metatrader 5.mq5
- Then copy renko-indicator for metatrader 5.mq5 to your metatrader 5 directory/expert/indicators
- Next, restart your MetaTrader 5.
- Select the chart and timeframe on which you want to test the mt5 indicator.
- Then look for "custom indicators" on your navigator which is already on your metatrader 5.
- Next right click on renko- indicator for metatrader 5.mq5
- Attach a graph
- Change the settings then click ok
- Renko indicator- indicator for metatrader 5.mq5 is available on your chart.
Strategi Trading Menggunakan Indikator Renko Chart
Some people say that the Renko chart strategy is a very good chart for trend trading compared to using candlesticks. Renko Chart itself is one of the alternative displays of price charts on the forex trading terminal. Renko can facilitate long-term trading, but with a number of conditions. Unlike other indicators, Renko has an unusual way of reading price changes. Price charts generally have a price plot for each specific time unit. Meanwhile, the Renko chart only contains prices, not time, and only displays price changes for a certain minimum amount as set. Price changes that do not match the parameters will then be filtered and removed. The Renko indicator filter will ignore small price movements to keep the focus on significant movements only, and of course can help eliminate market noise. This is different from most charting platforms that exist today. According to its basic function, the simple renko chart can make it easy for traders to see the latest market conditions. For example, the sequence of blocks moving down will make it easy to identify that the market is in a downtrend position. One simple strategy to try to follow the trend is to use each block as a direction signal. The rising block can be used to see the buy signal, while the falling block represents the sell signal. Of course, its application can be further expanded, depending on the strategy and plan. One example, on the 19-minute EUR/USD renko chart above, another indicator has been added in the form of a 10-period moving average (MA). The MA then rereads the renko value, in this case 10 renko blocks, not 10 minutes from the 19-minute duration. From here it can be seen that traders can use a combination of MA with renko blocks to generate trading signals. when the renko block falls below the MA value, this can be used as a sell signal. But when it breaks above the MA, this can be interpreted as a buy signal. There is no doubt that the renko indicator is the most useful technical tool for various purposes. The most basic benefit of the renko indicator is that it is able to show significant market movements. How much benefit is obtained will depend on the trader's plan. For example, if you want to try different settings from the renko indicator, traders can later get more effectiveness in its use. The best step to try is of course through a demo account, which has been proven to have no risk.In the indicator settings, you will choose the size of the Renko brick box yourself according to the volatility of the asset and the trading period. You can test the size of the brick box first before determining the optimal choice. Renko Chart has advantages such as easy to read, helps reduce market noise, indicators and experts can work better with renko. The use of Renko Chart is usually recommended for short-term traders (scalpers). Signals from Renko on the intraday time frame are considered more efficient than those on the daily chart. As is known, the renko chart does not use a time frame so that the sharpness of technical analysis depends entirely on your understanding of price action. The reason is, the renko chart can filter noise better than candlesticks during a trend. There are also uses for the renko chart, namely:
- When the trend is ongoing, it can maintain the position. Renko charts are easier to maintain positions to gain as much profit as possible, unlike conventional candlesticks that have quite high noise. That way, you can maintain your position so you can pursue your profit target as long as the price has not touched significant supply areas.
- Identifying demand and supply areas. Supply and demand areas can be determined from the renko bar chart that overlaps in a range. When demand moves down approaching the supply area, the pressure from buyers will be more dominant, meaning the opportunity to buy will be greater. Conversely, if the price moves up approaching the supply area, the pressure from sellers will be more dominant so that the opportunity to sell will increase.
- Telling When a Breakout Occurs. Beginner traders often have difficulty in determining whether the price has truly broken through the limits or is simply testing the S/R limits when there is a breakout at the support or resistance levels. Renko charts that have less noise than candlesticks will help show the price more clearly. Renko charts can confirm a breakout if there is more than one renko bar that has broken through the support and resistance levels.
Disadvantages of Renko Chart Indicator Trading
At first glance, the renko chart looks neater and free of noise than the candlestick chart. However, the renko chart also has its own weaknesses. Here are the limitations in using renko charts that you can consider when using this renko chart:- Cannot be an entry guide. In the renko chart there is no timeframe and OHLC, only the price movement interval in pips is visible. This will make it difficult for you to find which points and positions to open. It is better for you to continue using conventional candlestick charts for entry guides.
- Price action dynamics are not as accurate as candlesticks. There are not many price action dynamics that can be analyzed because the renko bar chart does not use the OHLC format as a price record indicator. You can only know that one renko bar chart represents a number of pip movements. While candlesticks have tens to hundreds of patterns. This means that the bars on the renko chart are more appropriate for analyzing price patterns.


