 Last:
Last: 
Understanding Commodity Channel Index
Technical analyst Donald Lambert developed the Commodity Channel Index (CCI) in 1980, as a means of considering the current average price in relation to the average price over a given period. The CCI is a way for traders to measure and identify potential overbought and oversold levels for a given market. The CCI is also used by traders to evaluate the strength and direction of a trend, and to identify potential buy or sell opportunities. Lambert designed the indicator with the commodities market in mind, but despite its name, it is applicable to other assets as well.How to Set Accurate CCI for Metatrader 5
The Commodity Channel Index (CCI) measures the current price level relative to the average price level over a specified time period. The CCI is relatively high when prices are well above their average. The CCI is relatively low when prices are well below their average. Using this method, the CCI can be used to identify overbought and oversold levels.Strategy Logic
Long Entry: When CCI Value is Above Upper Limit Long Exit: When CCI Value is Below Lower Limit or Price Reaches Target or Stoploss Short Entry: When CCI Value is Below Lower Limit Short Exit: When CCI Value is Above Upper Limit or Price Reaches Target or StoplossMT5 Settings
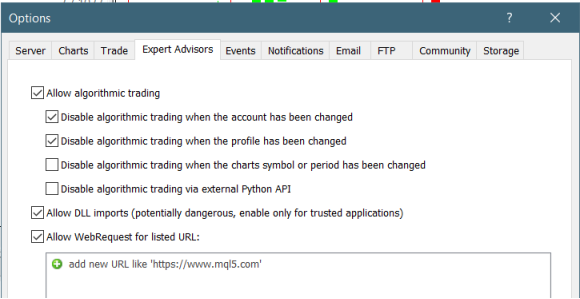
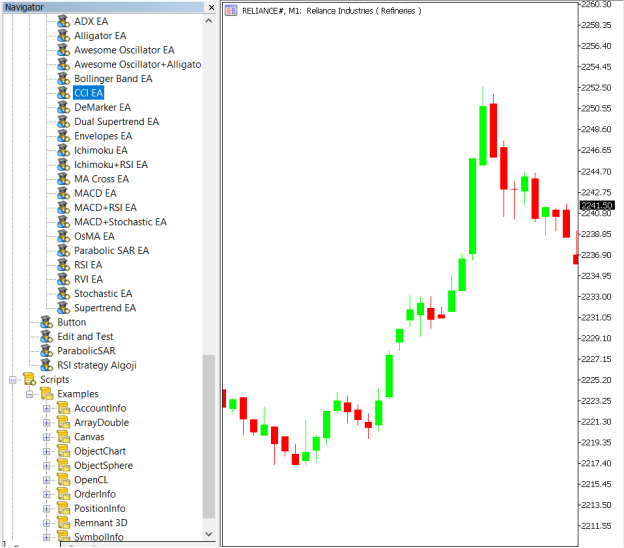
To start Algo trading with Commodity Channel Index on MT5, simply follow the steps given below.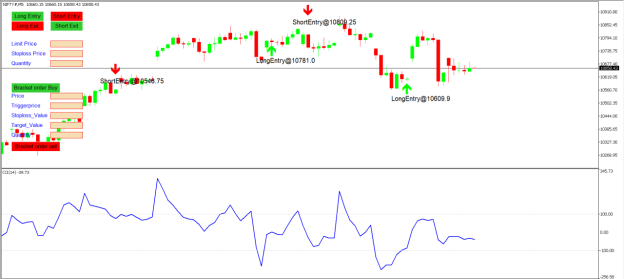
APIBridge Setup – New User
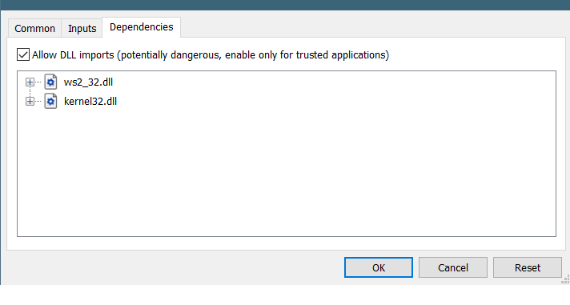
Before setting the EA to your system, it is recommended to add all symbols in APIBridge to avoid order rejection. Make sure you use the correct expiry tags and strategies as given in MT5.Strategy Parameters
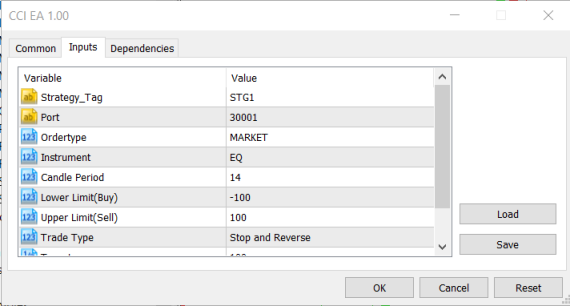
| Strategy tags | Use default STG1 unless trading in multiple strategies |
| Harbor | This should be the same as the application port the API bridge will signal from the same port. |
| expired | Put expired contracts here |
| Order Type | Select order type here from MARKET, LIMIT, SLL, SLM |
| Instrument | Set up instruments according to APIBridge |
| Candle Period | Candle Period for CCI Values |
| Lower limits | CCI value at which Buy Signal is generated |
| Upper limit | CCI value at which Sell Signal is generated |
| Types of Trading | Types of Trades to take |
| Target | Target Value in Rupees |
| Stop Loss | Stoploss Value in Rupees |
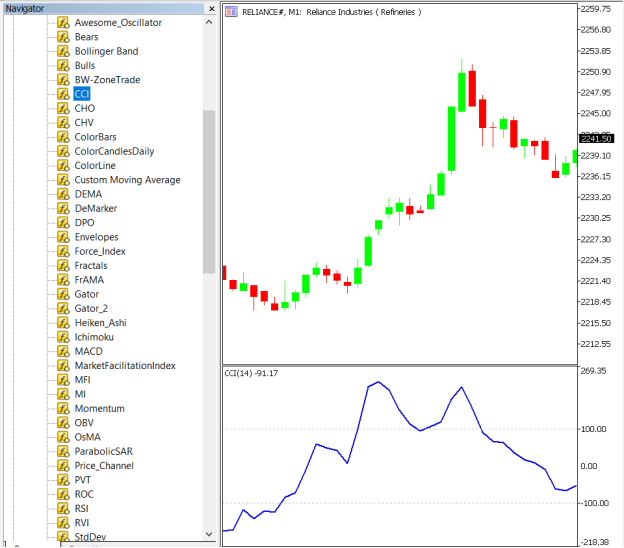
When plotting the Commodity Channel Index indicator, you can find it on the price chart below as an oscillating line inside a box. It is worth noting that the indicator is an infinite oscillator. However, the range from 100 to -100 is given by default, while some trading platforms have the option for traders to change the range. The default setting for the CCI is 20 periods, but you can change the number of periods depending on your preference. Keep in mind that a shorter period CCI will be more volatile, and a higher portion will be above or below the 100 and -100 values. Of course, a longer period CCI means a smaller percentage will be outside the 100 to -100 range. Traders read CCI values above 100 as a possibility that an uptrend is imminent, while readings below -100 could be an early warning of a downtrend. The following chart shows how the CCI would look on a chart.

CCI is a line that oscillates between positive and negative values and due to the constants included in it, CCI will mostly move between the intervals of 100 to -100. Therefore, traders consider values above 100 to be in the overbought area, while values below -100 are read as oversold warnings.
Strategy Using CCI
As mentioned earlier, CCI measures the difference between the current asset price and its average change. A high number indicates that the price is above its average and a low number means that the price is below its average. Therefore, CCI can be used to identify overbought or oversold levels. In most trading platforms such as MT4 the default period used is 14. Also, CCI has three lines. These are -100, 100, and 0.
As you can see above, the price tends to recover when the CCI reaches below -100. It tends to fall when it reaches +100. However, in between, you can see many false signals. This is an indication that you should not use CCI alone. It is always recommended to combine it with other oscillators, volumes, and trend indicators. Doing so will help reduce the chances of false signals.
Using CCI to find divergences
Divergensi terjadi ketika harga suatu aset bergerak berlawanan arah dengan indikatornya . Misalnya, saham mungkin naik sementara osilator turun. Ketika ini terjadi, biasanya merupakan sinyal bahwa pembalikan akan terjadi . Sebuah contoh yang baik dari ini adalah pada grafik di bawah ini. Seperti yang Anda lihat, tren keseluruhan pasangan USD/SEK naik sementara CCI menurun. Oleh karena itu, ini adalah tanda bahwa reli ke atas memudar dan harga akan menembus lebih rendah pada waktunya.
While divergences are useful, the challenge is that they usually take a long time to form and develop. As shown in the chart above, it took more than two weeks for this divergence pattern to emerge. To overcome this challenge, we recommend combining the CCI with other oscillators such as the Relative Strength Index (RSI) and MACD.
Advantages of Trading Using CCI
As you may have noticed, there are several advantages to using indicators… To start, it will help you identify when a new trend is emerging. Trying to catch the beginning of a move can be very difficult, and a tool to help you do that is definitely useful. You can also use it to identify weak or weakening trends using divergences. This can help minimize losses by giving you a reason to exit a position if you see price action weakening.Disadvantages of Trading Using CCI
Of course, there are drawbacks to many technical indicators, and the CCI is no different. When it comes to identifying whether a price is overbought or oversold, the CCI is subjective and previous levels where price may have reversed will have no bearing on future movements, although you may be able to recognize patterns over a period of time. It is also a lagging indicator, and as such, it will sometimes give poor signals because it lags behind price. For example, a CCI move above the +100 level may be too late because the move may have already been underway. Finally, there is the potential for many false signals. If the asset is volatile and prone to large price swings, then this can cause the CCI to give many potential signals in a short time frame… And in combination with it being a lagging indicator, it can lead to consecutive losses.

Setelah mengetahui mengenai Commodity Channel Index beserta apa saja yang berkaitan, maka langkah selanjutnya adalah menerapkan cara-cara yang telah dijelaskan di atas pada trading kalian sendiri. Selain itu, kalian juga bisa membaca mengenai indikator lainnya seperti Indikator Bollinger Bands: Pengertian dan Cara Penggunaan.
After learning about the Commodity Channel Index and everything related to it, the next step is to apply the methods explained above to your own trading. In addition, you can also read about other indicators such as the Bollinger Bands Indicator: Definition and How to Use.


