 Last:
Last: 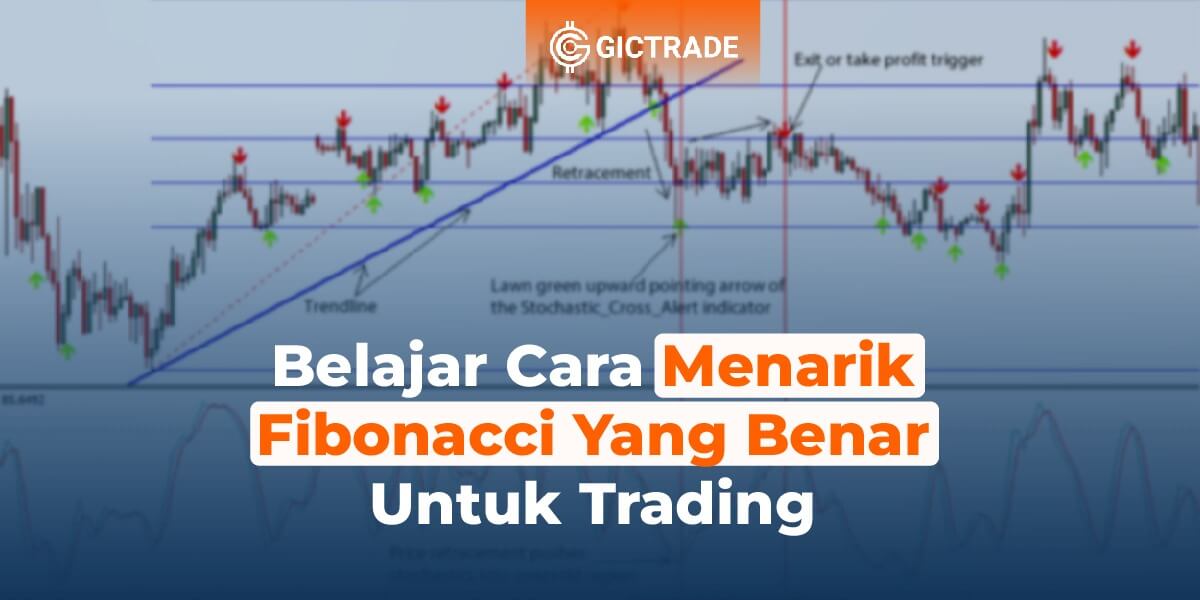
Table of Contents
What is Fibonacci
The correct way to draw Fibonacci is usually often used by active day traders. Day traders and technical analysts use Fibonacci levels to help them confirm entry levels and of course to target profits. This article, Jurnal GIC will help you explain how to draw Fibonacci correctly, so you can determine for yourself when to exit or enter forex trading. The Fibonacci number series or often called the golden ratio is a series of numbers that are the sum of the results of the two previous numbers. To make it easier for you to understand, the Fibonacci retracement numbers themselves start from 0,1,1,2,3,5,8,13,21,34,55. The series of numbers is obtained by adding the previous 2 numbers. For example, 0 + 1 then you will get 1, 1 + 1 then you will get 2, and if 1 + 2, then you will get the result 3, and so on.

Fibonacci ratios are generated by dividing the numbers from the entire series, then the calculation gives the trader the following ratios used in Fibonacci levels. Fibonacci ratios are translated into percentage numbers such as 23.6%, 38.2%, 61.8% etc. Then the percentages are applied to the form of a chart that makes it easier for traders to recognize opportunities between implied support and resistance in the market. As additional information, the Fibonacci ratio was discovered in 1202 by an Italian mathematician named Leonardo. Did you know that this ratio is also found in nature? This ratio is a form of perspective that exists in all aspects of life such as found in flower petals, waves, and the human body.
How to Draw Fibonacci Lines
Fibonacci retracement is made to make it easier for traders to know when a retracement will end. It is similar to support and resistance levels because it is a marker of where the price of a security will reverse during the retracement process. So how can you depict it on a chart?
How to use fibonacci retracement tradingview correctly consists of 4 steps, below is the Fibonacci tutorial that you must understand:
- Look for large zigzag lines.
- Identify the trend in the market, whether the price is down or up.
- Identify the lowest point of the major swing and also its highest point.
- Connect the 2 extreme points, starting from the highest to the lowest (down trend), and the lowest to the highest (up trend).
Now you have the Fibonacci retracement lines that help you show when the reaction will be down. To determine the main resistance level, you should start from the highest point and end with the lowest point. While to determine the support level, you start from the lowest point and end with the highest point.
How to Draw Fibonacci Retracement in Uptrend
The first step you must pay attention to is to check the latest prices and identify the high and low swings. After successfully finding these two points on the chart, the next step is to select the low swing and drag the cursor to the high swing. Then you can use the two reference points as the basic Fibonacci levels that will be plotted automatically on the chart.
How to Draw Fibonacci Retracement in Uptrend
To plot Fibonacci levels on a downtrend, you need to select a low and a high on the most recent swing high. Start with the highest swing high, then drag your cursor to the lowest low. Once you have successfully selected these two highs, your Fibonacci will automatically generate the relevant Fibonacci levels.
Fibonacci Extension
Fibonacci extensions refer to levels that are past 100%. These levels work the same way as retracement levels, but chartists only use them to map out how future swings will play out. Fibonacci extensions also follow the same series of numbers at 23.60%, 38.20%, 50% and so on. However, they have a 1 in front to be the hundreds percentage. For example, 38.20% becomes 382.00%, this is because it is past the 100% level.
How to Draw Fibonacci Extensions
When you draw a Fibonacci extension, it is important to find the trend you want to use as a basis. Find and select two swing points, then stretch the Fibonacci extension between the two edges of the swing. If you are measuring a bullish swing, you need to stretch the indicator from the low point of the swing to the highest point. While to measure a bearish swing, you stretch the indicator from top to bottom. Generally, the level is at 0.00% at the end of the swing that you take as a basis. After stretching the indicator, the extension level will be plotted automatically on the chart.


