 Last:
Last: 
What Is Hammer Candlestick
Traders in the financial markets often use candlesticks as a great visual aid to analyze and monitor what a particular price has done over a certain period of time. Candlestick patterns are the most versatile technical indicators for understanding market movements. Patterns can help traders gauge market sentiment for a particular financial asset. For example, a hammer candlestick is a bullish pattern that forms when the price of an asset falls from its opening price, reaches close to a support level, only to bounce back to close at a higher high. Speaking of bullish candlesticks, a popular pattern is the hammer candlestick formation. The hammer is one of the important reversal patterns that traders should pay attention to. The hammer is treated as a bullish reversal, but only when it appears under certain conditions. The pattern usually forms near the bottom of a downtrend, indicating that the market is trying to determine a bottom.How to Use Hammer Candlestick
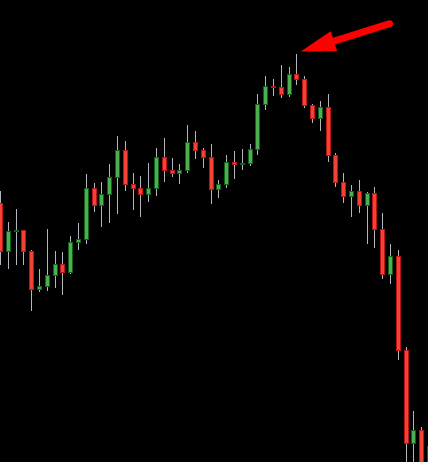
candle hammer bullish appears during a bearish trend and indicates a potential price reversal, marking the bottom of a downtrend. In the example below, we have a bullish hammer candlestick (image from TradingView).

Candlestick hammer bearish can be hanging man or shooting star . It appears after a bullish trend and indicates a potential reversal to the downside. In the example below, we have a shooting star (image from TradingView).
Thus, to use the hammer candlestick in trading, you need to consider its position in relation to the previous and next candlesticks. The reversal pattern will be discarded or confirmed depending on the context. Let's look at each type of hammer.
Hammer Candlestick Pattern
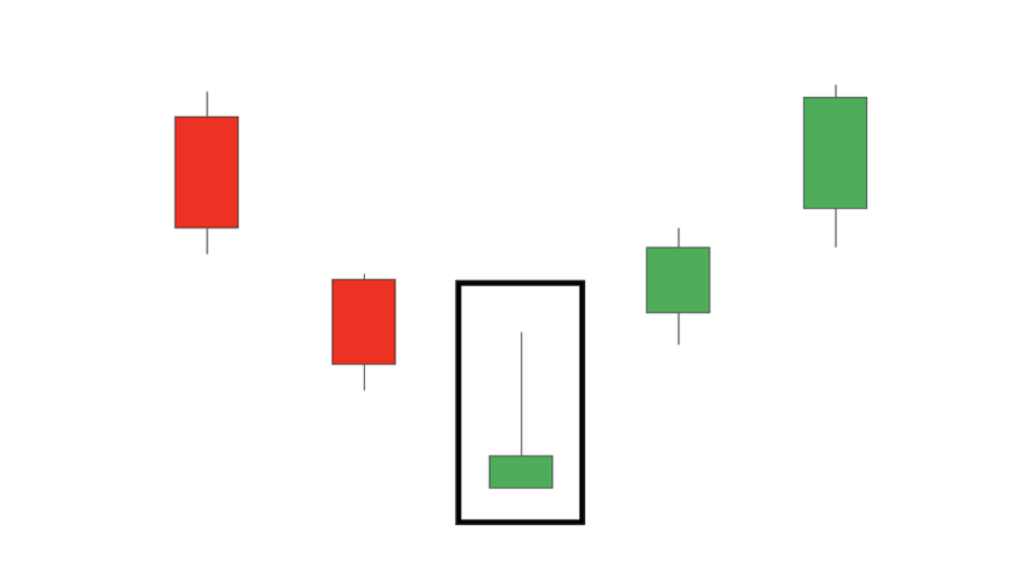
A hammer candlestick is formed when a candle shows a small body along with a long lower wick. The wick (or shadow) should be at least twice the size of the candle body. The long lower shadow indicates that sellers pushed the price down before buyers pushed it back up above the opening price. Below you can see the opening price (1), the closing price (2), and the high and low prices that make up the wick or shadow (3).
The hammer pattern is a one-candle bullish reversal pattern that can be seen at the end of a downtrend. The open, close, and top are all roughly the same price, while there is a long wick extending lower, twice as large as the short body. hammer candlestick pattern Regardless of the color of the body, both examples in the photo above are hammers. However, the left candle is considered stronger because the close occurred at the top of the candle, indicating strong momentum. On the other hand, the inverted hammer is exactly what its name suggests: an inverted hammer. The long shadow is pointing higher, while the close, open, and low are all listed near the same level. inverted hammer candlestick Similar to the hammer, the green version is more bullish considering there is a higher close. This pattern always occurs at the bottom of a downtrend, signaling an imminent change in trend. Again, the wick should be twice as large as the body. What the hammer formation tells you As mentioned earlier, both of these patterns are considered strong reversal patterns. Following a downtrend, where price action creates a series of lower lows and lower highs, bulls increase their presence in play and signal that there may be a change in price direction. Thus, the hammer signals a potential change in price direction, as the bears were unable to follow through on the new short-term low allowing buyers to push prices higher to force a higher close. This is a higher close that signals that the bulls have just taken control of the price action, as they defeated the bears in a crucial battle near the session low. Similarly, the inverted hammer also sends the same message, but in a different manner. The price action opened low, but pushed higher to the surprise of the bears. However, the bears still had control and they pushed the price action back to close near the low. Unlike the hammer, the bulls in the inverted hammer were unable to secure a higher close, but were defeated at the closing stage of the session. However, the fact that the buyers were able to push prices higher shows that they were testing the resolve of the bears. The fact that the bullish hammer managed to close at the top of the candle is why the hammer is considered stronger than the inverted hammer. This is a logical sequence since the hammer is considered one of the most powerful candlestick patterns of any type. It is important to note that neither of these patterns are direct trading signals, but rather tools that produce a sign that price action may reverse as the balance shifts. To master the hammer and inverted hammer, as well as other technical indicators and formations, you may want to consider opening a demo trading account, which you can access here . This way you will prepare yourself before you start risking your own capital. How to trade the hammer candlestick pattern As stated earlier, the hammer is a bullish reversal pattern. It occurs at the end of a downtrend when the bears are starting to lose their dominance. In the chart below, we see a daily chart of GBP/USD where price action moved lower to the point where it made a new short-term low. Although the session opened higher from the recent low, the bears pushed price action lower to secure a new low. However, the bulls surprised them by pushing higher to secure a bullish close (green). At this point, it is clear that the balance has shifted in favor of the buyers, and there is a high probability that the trend direction will change. There are two options available:
- Open a trade as soon as the hammer forms and wait for a potential reversal to begin.
- Wait for the second candle for confirmation. If the candle is bullish (green), enter a trade to take advantage of the reversal.
Inverted Hammer Candlestick
The inverted hammer candlestick is a type of chart pattern that often occurs at the end of a downtrend when buying pressure is driving up the price of an asset. It is so named because of its appearance, which resembles a real-life inverted hammer, with a very short lower shadow and a long upper shadow that is more than twice the size of the original body. It signals a bullish reversal pattern where the upper wick is extended indicating that bullish traders in the market are trying to push the price of the security higher. It should not be mistaken for a bearish shooting star pattern that occurs at the end of an uptrend or a hanging man pattern. The inverted hammer pattern is only an indicator of potential price changes and is not a definitive signal to invest in a particular commodity. The inverted hammer candlestick pattern indicates a bullish reversal or a short-term downtrend reversal. The inverted hammer occurs after a prolonged sell-off when the price is near its low for the period. It is easy to spot on a chart because it resembles an inverted, hanging shooting star candlestick formation. The body can be white or black, but is often black, indicating buying pressure at that low price. The shadow of the inverted hammer can be long or short; if it is longer than the body, then there is more buying pressure at that low price compared to selling pressure. Therefore, it should only be used for technical analysis purposes, not fundamental ones. Like other forms of technical analysis, there are many different rules about how traders interpret the inverted hammer candlestick based on various indicators and trading strategies. One example strategy involves using the typical inverted version of this candlestick chart pattern as a possible bullish reversal signal that could lead to higher prices soon if it appears after a significant downtrend in price activity. The inverted hammer candlestick can also appear during periods when there is no clear direction in a trend. In these cases, a strong argument can potentially be made for both a continuation and a reversal signal based on its position within trending or ranging market activity.How to Use Inverted Hammer Candlestick
Every trader should be aware that no pattern is truly informative when used or analyzed on its own. Simple identification of an inverted hammer candle is not enough for successful trading, including (forex, stocks, or even cryptocurrencies). There are other key factors, such as price action or the position of the inverted hammer candle, that need to be considered when assessing a position. If a trader is confident that he has correctly identified the pattern, then it is necessary to start looking for other signals to confirm a possible reversal. However, this is only a warning but not a signal by itself to buy.
 Since the inverted hammer cannot be considered a defining signal, it works well in combination with some classical technical analysis patterns.
Double Bottom
On the other hand, the Double Bottom is one of the most powerful reversal patterns. It resembles the letter “W” because it consists of two consecutive lows that are almost equal, with a medium peak in between. The inverted hammer at the second bottom on this chart confirms the Double Bottom, and both indicators are signaling that the market is moving up. A trader should wait for the market to close above the inverted hammer price to buy.V-bottom
This is another technical analysis pattern that gets its name from the letter. It is shaped like the letter V and appears when the price momentum changes from an aggressive selling condition to an aggressive buying condition. The inverted hammer usually forms before a trader enters a trade. So when the market closes above the inverted hammer price, it is time to take a long position. Remember that it is necessary to trade both of these patterns with support levels, as they tend to bounce off the trend. Of course, there are also other ways to use the inverted hammer in trading. For example, a trader can profit from a pullback in an uptrend. In this case, the inverted hammer indicates a possible entry on a pullback.Trading Rules
This pattern can be incorporated into a profitable day trading strategy if a trader takes into account some common considerations and scenarios. Since this is a bullish candlestick pattern, only buy rules can be applied to it. Reversal points. It is very important to identify possible price reversal points on the chart. These can be support and resistance levels, an uptrend line, etc. Time to enter a trade. Entering a trade after the formation of a confirmation candle is tolerated. Such a strategy means that there will be a lower risk of entering a trade, but the buy price will be higher, and the trader's profit will be much lower. Stop loss. Traders set stop-loss limits according to their forex trading outlook. But as a rule of thumb, they are 2-3 units lower than the low price of the inverted hammer candle. It is very important to follow the stop-loss strictly because trading candlestick patterns can never be considered a failure. Trademarks. Some important characters to look out for include:- The longer the upper wick, the more likely a reversal will occur.
- The color of the candle does not matter although a white (green) candle is considered a more bullish sign than a black (red) candle.
- Pay attention to the body of the confirmation candle. The larger it is, the more serious the uptrend reversal trading signal.
Inverted Hammer Candlestick Type
Here are the types of inverted hammer candlesticks themselves. You can see the types in the explanation below.Inverted Hammer Bullish
The Inverted Hammer is a bullish pattern found during a downtrend. The Inverted Hammer looks like an inverted version of the Hammer candlestick pattern. It consists of a candle with a small body and a long upper wick. It is a one-day bullish reversal pattern. The bearish version of the Inverted Hammer candlestick pattern is the Shooting Star pattern.

Input: Traditionally, this candlestick pattern is recognized in relation to a certain trend direction, i.e. it may be important for the pattern if the price has been generally rising or falling. The 'Detect Trend Based On' option allows you to specify which method will be used to detect the following trends:
- SMA50 - the indicator compares the current price of the symbol with the Simple Moving Average (SMA) with a length of 50. If the current price is below the SMA, this price movement is considered a downtrend. If the price is above the SMA, it is an uptrend.
- SMA50, SMA200 - the indicator separately compares the current price with SMA50 and SMA50 with SMA200. If the current price is above SMA50 and SMA50 is above SMA200, this is considered an uptrend. If the price is below SMA50 and SMA50 is below SMA200, this is a downtrend.
- No detection - the indicator does not take into account price trends.
Inverted Hammer Bearish
The Inverted Hammer pattern can be either bearish or bullish depending on how it forms. For example, if the inverted hammer occurs after a bullish candlestick and then the price goes up, it would be considered bullish. However, if the inverted hammer occurs after a bearish candlestick and then the price goes down, it would be considered bearish. The inverted hammer tells traders that buyers are putting pressure on the market. It warns that there may be a price reversal following the bearish trend. It is important to remember that the inverted hammer candlestick should not be viewed in isolation – always confirm the possible signal with additional formations or technical indicators. Finally, consult your trading plan before acting on the inverted hammer.Difference Between Hammer Candlestick and Inverted Hammer
A hammer pattern is a candlestick that has a long lower wick and a short body. With little or no upper wick, the hammer candlestick should resemble a hammer. This bullish reversal pattern occurs at the end of a downtrend, signaling that a bear market may be about to bounce back into an uptrend. To see why it looks like a bullish reversal pattern, we can take a closer look at the potential price action during the session. The long lower wick indicates that the period began with sellers still in control, continuing the downtrend and pushing the market to a new low. But the short body means that buyers fought back and pushed the price back up towards the open before the session closed.- If the hammer is red, buyers took the market close to the open.
- In the green hammer pattern, buyers pushed the market back above the open, creating a stronger signal.
Look for nearby support areas to place your stops, and resistance levels that may serve as profit targets. And always confirm that the trend is in place before you fully commit to your position. At this point, you may also want to check that the exit points you have identified are in line with your chosen risk-reward ratio.
Benefits of Using Hammer Candlestick
- Good Entry Points: It is ideal to initiate a trade on the day the inverted hammer is identified to reap the most benefits of the security’s appreciation due to the bullish reversal. This is especially true if the pattern immediately triggers a healthy uptrend in the asset’s value.
- Ease of Identification: It is relatively easy to identify due to the strict criteria associated with its recognition, namely the proportionality between the shadow and real body lengths and its location within the trend line.


