 Last:
Last: 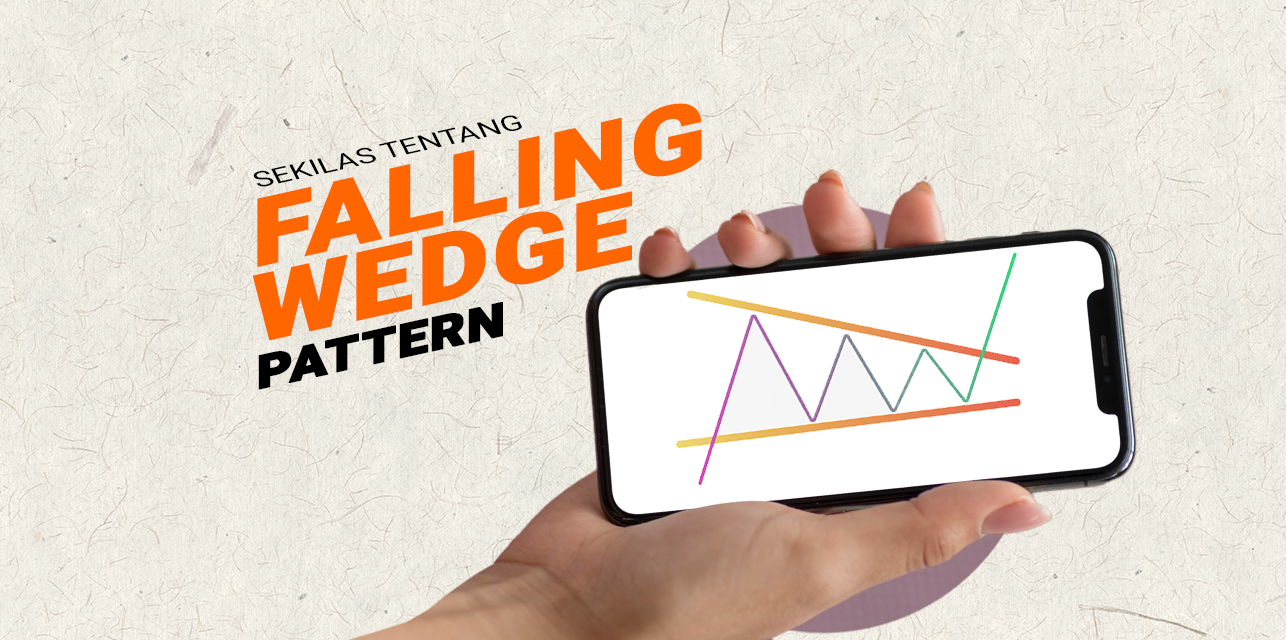
What is Falling Wedge Pattern?
The falling wedge pattern is a continuation pattern that forms when price is bouncing between two downward sloping, converging downward sloping trendlines. It is considered a bullish chart formation but can indicate both a reversal and continuation pattern – depending on where it appears in the trend. The rising wedge is the opposite of the falling wedge pattern and is also seen in downtrend markets. Traders must know the difference between the rising and falling wedge patterns in order to identify and trade them effectively. The falling wedge is a bullish pattern that starts wide at the top and contracts as price moves lower. The price action forms a downward sloping cone as the reaction highs and reaction lows meet. Unlike symmetrical triangles which have no definitive slope and no bias, falling wedges are definitely downward sloping and have a bullish bias. However, this bullish bias is not realized until a resistance breakout occurs. As a continuation pattern, the falling wedge will still slope downward, but its slope will be against the prevailing uptrend. Regardless of the type (reversal or continuation), a falling wedge will be considered a bullish pattern.Falling Wedge Pattern Criteria
The falling wedge chart pattern is a recognizable price action pattern. It can be created when the market is consolidating between two converging support and resistance lines. In order to form a falling wedge, the support and resistance lines must be sloping downward. The resistance line must be steeper than the support line. This pattern is a bullish pattern that starts widening at the top and contracts as price moves lower. This price action forms a cone that slopes downward when the reaction high and reaction low meet. Unlike symmetrical triangles, which have no definitive slope and no bias, falling wedges slope downward and have a bullish bias. However, this bullish bias cannot be realized until a resistance breakout occurs. Depending on where it is found on the price chart, a falling wedge can also be used as a continuation or reversal pattern. One of the main features of the falling wedge pattern is its volume, which decreases as the channel meets. After consolidating energy within the channel, buyers can shift the balance in their favor and launch price action higher. Therefore, here are three main characteristics of the falling wedge pattern:- Price action will temporarily trade in a downtrend (lower highs and lower lows);
- There are two trend lines (upper and lower) which are converging lines;
- There is a decrease in volume as the channel develops.
Falling Wedge Pattern Example
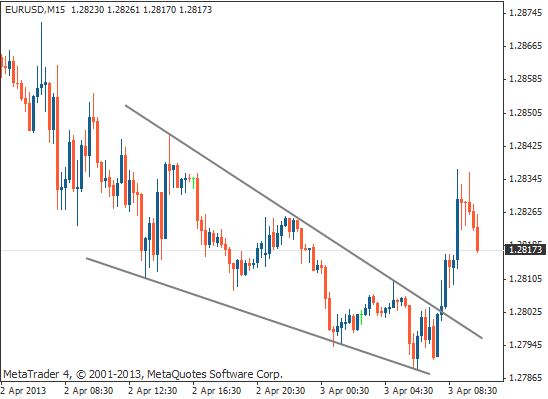
If the falling wedge appears in a downtrend, it is considered a reversal pattern. It occurs when price makes lower highs and lower lows that form two contracting lines. Falling wedges usually precede a reversal to the upside, meaning you can look for potential buying opportunities. The chart below shows an example of a falling wedge in a downtrend:
A falling wedge found in an uptrend would be considered a continuation pattern as the market would temporarily contract. This would indicate the start of an uptrend. Again, this would mean you could be looking for potential buying opportunities. The chart below would show a falling wedge in an uptrend:

Falling Wedge Pattern Accuracy
Wedge patterns are one of the tools that will be used to be able to find out the continuation of a price movement. This tool has become quite popular among traders and analysts because it has an accuracy level of up to 70%. This falling wedge pattern can indicate a reversal of the trend direction from down to up or it can also indicate a continuation of the trend to continue to rise. Both will provide opportunities to buy. Both reversals and continuation of a trend direction, this pattern also has quite good accuracy so it will be very suitable for use as part of a trading strategy. This wedge pattern has two characteristics, namely if the breakout will be opposite to the direction of the wedge, then it becomes more accurate and the steeper the wedge, the more accurate the results. Please note, this falling wedge pattern has a very high level of success accuracy, especially when trading gold or XAUUSD (Gold).Falling Wedge Pattern Bearish dan Bullish
This rising wedge pattern will usually indicate that the price of the related crypto asset will experience a bearish condition. Conversely, the presence of a falling wedge pattern in the price movement of the crypto asset will indicate that the price is bullish.

Notice how a rising wedge forms when the market has started making higher highs and higher lows. All of the highs should be in-line so that they can be connected by a trend line. The same goes for the lows. It would not be considered a valid rising wedge if the highs and lows were not in line. Since the two levels are not parallel, it would be considered a terminal pattern. This implies that the pattern must eventually end. A falling wedge is the opposite of a rising wedge where the bears will take control, making lower highs and lower lows. This also means that the pattern is likely to break out to the upside. The illustration below shows the characteristics of a falling wedge.

In the above illustration, it suggests that the situation has a period of consolidation where the bears will clearly be in control. Because the market is making lower highs and lower lows. Notice how all the highs are aligned with each other as well as the lows are aligned. If the trendline cannot be placed cleanly at both the highs and lows of the pattern, then it cannot be considered valid. Lastly, when identifying a valid pattern for trading, both sides of the wedge must have three touches. In other words, the market also needs to test support three times and resistance three times before breaking out. Otherwise, the situation cannot be considered tradeable.
Falling Wedge Pattern Breakout
When the price of a security has been falling over time, the wedge pattern can occur just as the trend is making its final down move. Trendlines drawn above the highs and below the lows of a price chart pattern can converge as the price decline loses momentum and buyers step in to slow the decline. Before the lines converge, the price may break above the upper trendline.
:max_bytes(150000):strip_icc():format(webp)/dotdash_Final_Wedge_May_2020-02-67d7156b6b40435584b05b73f969181c.jpg)
When price is breaking above the upper trendline, the security is expected to reverse and trend higher. Traders who identify a bullish reversal signal will want to look for trades that benefit from the rising price of their own security.
After learning about the falling wedge pattern breakout, you can take the time to fill out the internal survey from GIC so that our team can improve performance when making updates.How to Trade Using Falling Wedge Pattern
- Identify the wedge on the chart. Draw trendlines along the swing highs and swing lows to highlight the pattern.
- Watch for the breakout. This means that the price is moving outside the wedge pattern that was drawn.
- Confirm the breakout. Verify that price has moved outside of the wedge. Check the trendline to make sure you have drawn it the way you intended (it will usually be drawn along, and connecting, swing highs and swing lows).
- Enter a trade. You can open a buy position if the price has crossed above the upper trendline of the falling wedge, or a sell position when the price has fallen below the lower trendline of the rising wedge. After the price has broken out, it will sometimes come back to retest the old trendline of the wedge. This can provide another opportunity to enter.
- Set a stop-loss order for the trade. Some traders will choose to place their stop-loss just outside the opposite side of the wedge breakout. Others may place their stop loss closer in order to keep the stop-loss size smaller. Therefore, risk management is an important element in trading.
- Set a profit target or choose how you will exit a profitable position. A possible profit target estimate is the height of the wedge at its thickest point, added to the breakout/entry point.
- Trailing stop-loss can also be used. If the price action is moving in your favor, the stop loss will trail behind the price to help lock in profits.
- Consider the risk/reward ratio before proceeding. Once you have set your entry, stop-loss, and target, consider the potential reward offered by the trade. Ideally, the potential reward should be twice the risk. For example, if the profit target is 1000 pips above the entry, as in the chart below, then ideally the difference between the entry stop-loss (risk) should be 500 pips or less. If the potential reward is less than the risk, it will be harder to make money on many trades, as the losses will outweigh the wins.

Falling Wedge Pattern vs Descending Triangle
The difference between a descending triangle and a falling wedge is:- A descending triangle has a flat base with lower highs or a descending trendline, while a falling wedge does not have a flat base.
- Falling wedge is a bullish pattern and follows the main uptrend, while descending triangle is a bearish pattern.
Advantages and Disadvantages of Falling Wedge Pattern
This falling wedge pattern has several advantages and disadvantages in its use in trading, below is a brief explanation:Advantages;
- Often found in forex trading, especially during short term time frames such as M15, M30, H1 and H4.
- It is easy to determine the entry of the wedge pattern that has been formed. Because the pattern that is formed will be quite easy to guess.
- It is easy to place the position of the stop loss area correctly, and according to the data based on the pattern that has occurred, the benchmark is from the wedge pattern.
- Easy to find the lowest high point and also find the lowest low point. As a reference for the trend line.
- Can determine the area for take profit according to the data on the pattern that has been formed. Even some traders usually take the opportunity to take profit with long pips.
- It is easier when making entries combined with an oscillator as an additional confirmation.
Disadvantages;
- For beginners, it will be a bit confusing if they cannot truly master the price patterns in the market.
- It is very rare to happen during large time frames such as Daily, Weekly, and Monthly. So for long-term traders, it is not certain that this pattern will be effective in taking long-term profits.
- Sometimes traders fail to define the results of the next trend direction, because they are too hasty in concluding the falling wedge pattern, even though the pattern does not fully meet the requirements/rules of a perfect wedge.


