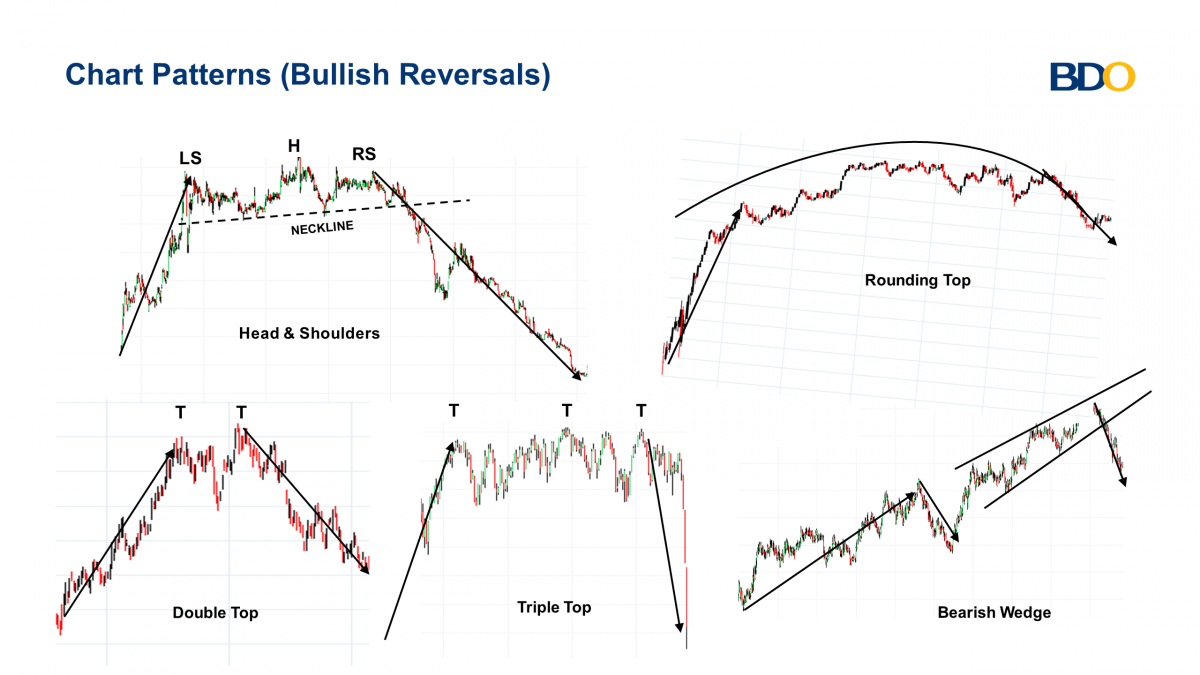
Bullish reversal has various patterns that must be understood. Bullish reversal itself consists of inverted hammer, bullish harami, engulfing, morning star, and piercing line. This time we will discuss some of these types. For more details about this bullish reversal, you can read the article below. In addition, you can read other articles such as Descending Triangle Bullish: Characteristics, Types, Examples, and How to Read.
What Is Bullish Reversal


Characteristics of a Bullish Reversal Pattern
Bullish reversal itself is in the morning star pattern. The morning star pattern is a bullish reversal pattern that appears at the bottom of a downtrend. This indicates that sellers have lost their momentum, and buyers have taken control of the price in an uptrend. This is a combination of several candles with a U shape, indicating a shift in trend direction. This pattern is very effective when prices have been moving down for quite a long time, but a momentum reversal seems imminent. The morning star candlestick pattern is a combination of three candles with the following characteristics:
- Day 1 : large bearish daily candle at the bottom of the downtrend.
- Day 2 : A small candle, either bullish or bearish.
- Day 3 : A big bullish daily candle.


The above image shows the exact formation of the morning star pattern on the price chart. Day 3 opened with a bullish boundary and closed higher above Day 2. Some common aspects of this pattern are as follows:
- Morning star is a bullish pattern that appears at the bottom of a downtrend.
- The morning star pattern from a strong support level has the maximum probability of success.
- If the Day 3 candle is more significant than Day 1, the pattern is stronger.
- Day 2 should open with a bearish gap, and Day 3 should open with a bullish gap.
Bullish Reversal Conditions
For the requirements of the Bullish Engulfing Pattern, look for the following important criteria:- A clear downtrend should be in progress.
- There should be a small black candle at the bottom of the downtrend.
- The white candle must follow the black candle and its body must completely cover the black candle (engulf it).
- The top of the white candle should be above the top of the black candle, and the bottom should be below the bottom of the black candle.
- candle must occur after a downtrend.
- The upper shadow should be at least twice the height of the candle body.
- The lower shadow should be absent or very small.
- The body should be located at the lower end of the trading range.
- The color of this small body is not important, although it can indicate a slightly more bullish or bearish bias.
- Price must be in a downtrend before the signal appears.
- The first candle should confirm the downtrend with a long black (or red) body. This shows that bears have strong control over the stock.
- The second candle should convey a state of indecision either through a star candle (of either color) or a Doji.
- This shows that supply and demand are equal, and bears and bulls are fighting for control.
- The third candle must be represented by a white (or green) candle that closes at least half of the black (or red) candle of the first day.
- This last candle confirms that a reversal will occur.
Example of a Bullish Reversal Candlestick
As mentioned before, the occurrence of the morning star pattern is not as frequent as the single candle formations. They are more difficult to recognize, besides you practically have to meet all four conditions before you can verify its existence. In this case, we have the AUD/USD daily chart. The price has been trading lower to the point where it has created a new short-term low. Before this candle, there was a long bearish candle indicating a strong downtrend.
However, sellers failed to force a close near the session low and price rebounded higher to create a doji candle, which indicates indecision among buyers and sellers. The next candle was a long bullish candle that formed a morning star pattern. We are now almost certain that a bullish reversal is about to take place.
How to Read Bullish Reversal
Here is an example of a bullish reversal with a bullish harami pattern. Identifying a bullish harami pattern on a trading chart is quite easy and simple. However, finding the pattern is usually not enough and you need to combine it with other indicators to confirm the pattern. Below, we will show you how to confirm a bullish harami pattern and find good entry and exit levels using the RSI, MACD, and Fibonacci ratios.Bullish Harami Chart Pattern with MACD and RSI
Since the bullish harami is a trend reversal pattern, you want to confirm the reversal with another momentum indicator. The MACD and RSI are two of the most important momentum indicators you can use when identifying a bullish harami pattern. In the chart below, we added the RSI and MACD so we can confirm the price reversal.
As seen on the 30-minute GBP/USD chart, the RSI crossover occurred right at the same time as the bullish harami appeared and was above the 30 level. The MACD crossover, on the other hand, occurred even before the pattern occurred which gives a strong indication that the bearish trend momentum has ended.
Bullish Harami Chart Pattern with Fibonacci Retracements
Using Fibonacci retracement levels in combination with the bullish harami pattern as a trading strategy can be tricky. You have to identify the previous highs and lows of the previous trend to draw the Fibonacci levels correctly and sometimes, you may even have to change the timeframe. However, when you can find the boundaries of the previous trend, Fibonacci support and resistance levels can help you confirm the trend reversal and find the right entry levels. In the chart below, we have drawn Fibonacci retracement levels from the highs to the lows of the previous trend. As you can see, the 61.8% level helps us find a good entry level. In addition, a stop-loss can be placed at the 78.6% level and take-profit targets at 50%, and 38.2%.
Trading Benefits Using Bullish Reversal
The advantages of the inverted hammer are:- Good Entry Point: It is ideal to initiate a trade on the day the inverted hammer is identified to reap the most benefits from the security’s appreciation due to the bullish reversal. This is especially true if the pattern immediately triggers a healthy uptrend in the asset’s value.
- Ease of Identification: It is relatively easy to identify due to the strict criteria associated with its recognition, namely the proportionality between the shadow and real body lengths and its location within the trend line.
- Easy to identify
- Opportunity to take advantage of big moves with a high risk-reward ratio
- Widely used in forex trading
 Last:
Last: 


