 Last:
Last: 
What is Bullish?
When entering the world of stocks, then we will certainly meet many special terms that are commonly used by investors. They will certainly use these terms to be able to describe the current stock price movement conditions and are important to know. There is also the term Bullish which is a stock term and will often be juxtaposed with the opposite term, namely bearish.If you look at the movement, then Bullish will describe the market condition where the trend being experienced is strengthening. Bullish is a term that has been taken from English, namely "Bull" with the meaning of a bull, whose movement will attack and also raise its horns upwards. In addition, philosophically, the term Bullish will indicate the market performance that is experiencing an increase.
In some stock exchange offices in the world, this Bull is a landmark that means that the stock index in the country will always experience strengthening or also called Bullish. The bullish trend is a trend of increasing prices in industrial stocks or also an increase in the index in the market as a whole, which will be marked by high investor confidence.
Bullish market conditions are also conditions when investors are optimistic, usually also marked by an increase in the market index of 20 percent. Before continuing to explain what bearish itself is, you can take a little time to conduct a user satisfaction survey in the services that GIC has provided.
What is Bearish?
A bearish trend in the financial market can be defined as a downward trend in the prices of industrial stocks or a decline in the market index as a whole. This bearish trend will be marked by strong investor pessimism about the scenario of a decline in market prices. A market that is currently experiencing a downward trend in prices over a long period of time will be called a bear market.Meanwhile, for people who call bearish stocks will refer to stocks whose prices are decreasing. A price decrease of around 20 percent will be identified as a bearish trend. If bullish will refer to a positive condition, then the term bearish will be interpreted as a condition in the stock market that will experience an overall decline.
This bearish will also be marked by a decline in a stock price index (downtrend). If the bearish market continues, then generally traders and investors will take cut loss action or sell shares to minimize greater losses.
Bullish and Bearish in Forex Technical Analysis
Bullish is a term that is also very popular in the world of forex trading. Which is a condition where the price in the market is strengthening continuously in a certain period of time. This strengthening will occur in several financial aspects and business sectors. The term Bullish is also often thrown out by traders if the condition of their financial assets still does not show any upward movement.While specifically for Forex trading, this bullish term will refer more to the condition of the Base currency of a currency pair that is strengthening in value, while the Quote currency will experience a decline (Uptrend). And for bearish is a condition where the stock market will refer to the decline in a stock price as a whole.
The market condition that is experiencing bearish will be marked by a decline in the stock price index as a whole. The term bearish is also commonly used by investors who make predictions or an attitude of believing that stock prices will move down later. Usually, investors who are experiencing bearish will sell their shares. This bearish stock market will be marked by market conditions that will later show a decline (downtrend).
Investors or traders who see signs of a downtrend tend to believe that negative things can happen to the market. Bullish and bearish itself can be understood by doing a Preliminary Test for traders so that you can measure how talented you are in understanding trading itself.

Difference between Bullish and Bearish in Forex Market
The bearish market will reflect pessimism in market players. Usually this condition will be preceded by a sharp decline in prices, although in reality there will be a correction in the rising price but the direction of the main trend movement will remain bearish or the downward pressure on prices will be stronger. In bearish stock market conditions there is usually a weakening economy and an increasing unemployment rate.
There is also a decline in consumer spending and the flow of new investment is decreasing or stopping. In contrast to bearish conditions, a bullish market will reflect a state of optimism among market players. This condition will be preceded by a sharp price increase, although in reality there will be a downward price correction but the direction of the main trend movement will remain bullish or there is a push for a stronger price increase.
For example, EUR/USD is bullish, but a few hours after that time a reversal could occur where this currency pair will continue to experience bearish for the next few days. After learning the difference between bullish and bearish, you can invite your friends to join in trading on GICtrade so that you can get various benefits from joining the GICAffiliate program. Or, you can also join as an IB in this program and get various bonuses and benefits when you become an IB.

Examples & Pictures of Both in Forex Market
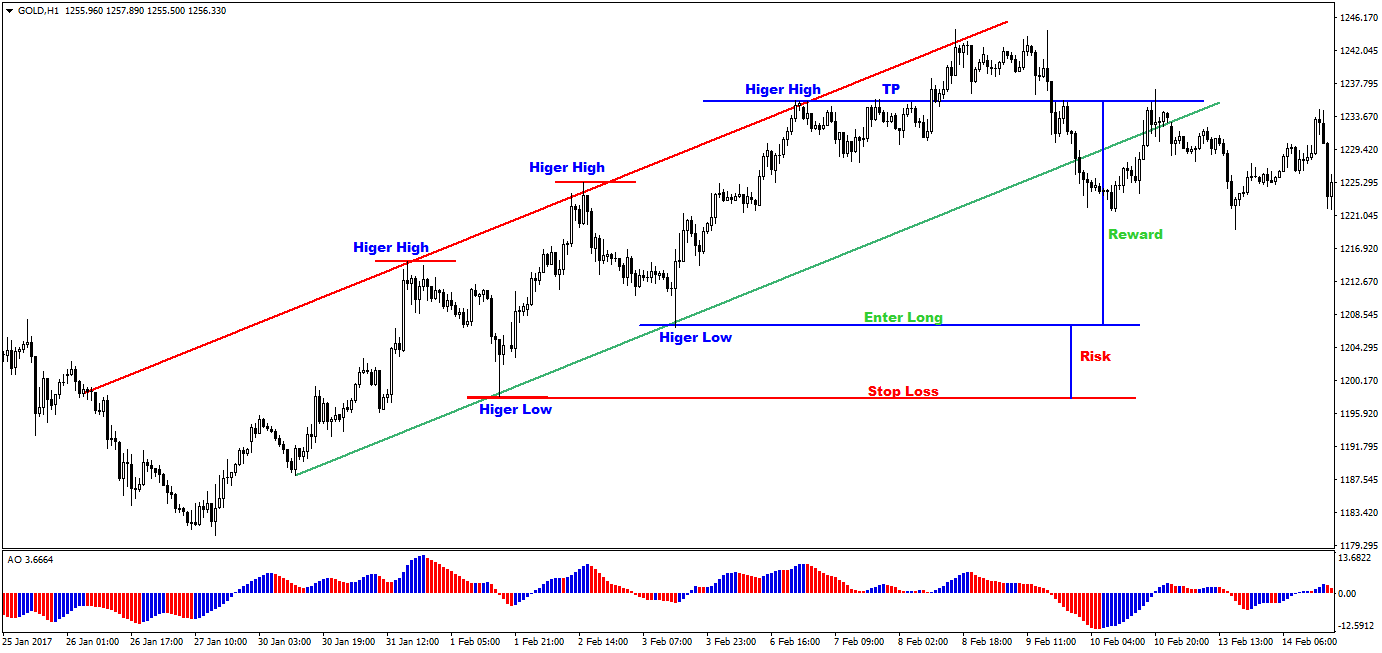
Below are examples of how bullish and bearish conditions are in the forex market in real time which you can understand through the example images below.Bullish Trend Example
With this type of bullish trend, the price makes higher highs and higher lows continuously. The lower trendline of the channel acts as support while the upper trendline of the channel acts as resistance. Trading Bullish Trends:- Long taken on channel support
- Stop loss is placed below the previous low
- The target should be the next channel resistance
The image below shows an example of a bullish channel.
Bearish Trend Example
In a bearish/falling price makes lower lows and lower highs. The lower trendline of the channel acts as support and the higher trendline of the channel acts as resistance. Bearish Trend Trading:- Shorts are taken at channel resistance
- Stop loss is placed at the previous high level
- The target should be the next channel support
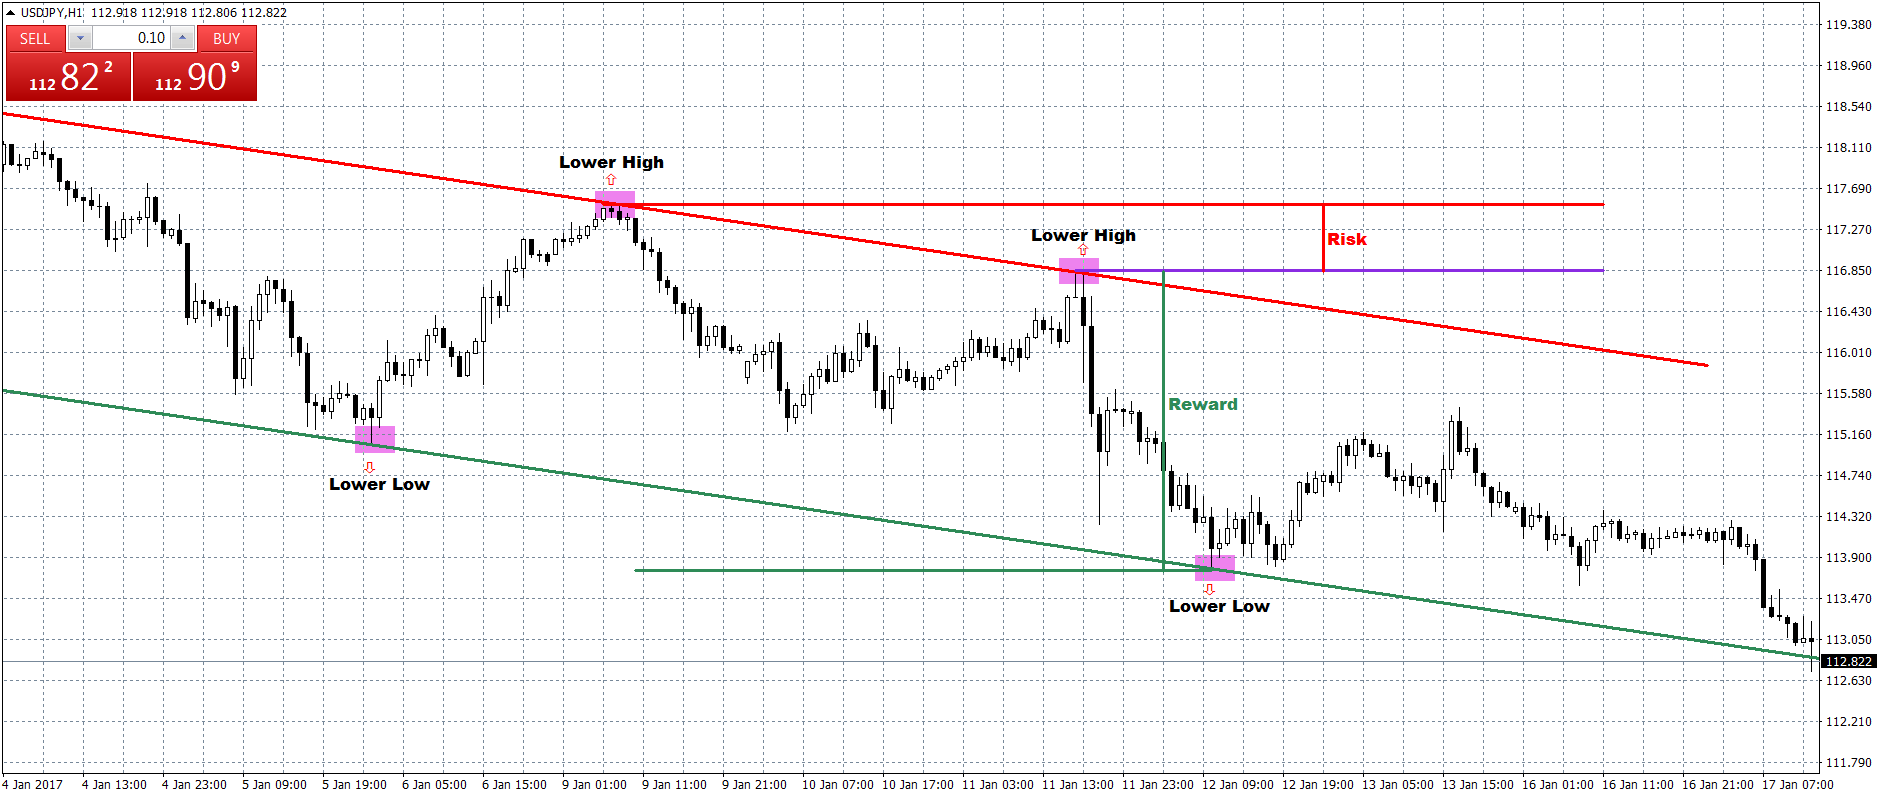
Figure 2: Example of a bearish channel
Bullish and Bearish Indicators
There are several indicators in trading in bullish and bearish conditions. You can use these indicators to help you in trading. These indicators are:RSI Bullish and Bearish
Relative Strength Index or RSI is a technical indicator that can be applied in the analysis of financial markets, including the stock market. A mechanical engineer, J. Welles Wilder, has introduced this method since 1978 through Commodities Magazine and his book entitled New Concepts in Technical Trading Systems. The RSI itself acts as a momentum parameter, namely measuring price movements in the market.The increase in momentum indicates that the stock is being actively purchased, while the decrease will indicate a weakening trend in the stock in question. In addition to momentum, the RSI can also be an oscillation parameter. This means that traders can find out whether the market conditions are overbought or oversold. On a scale of 0-100, the value of the asset will be considered to be in an oversold situation when its value is less than 30. Meanwhile, overbought occurs when the RSI value exceeds 70.
MACD Bullish and Bearish
Moving Average Convergence Divergence (MACD) is an indicator in technical analysis that will describe the relationship between two moving averages on an asset price trend. The moving average itself is an explanation of the average price, both for the opening and closing of trading each day, which will be depicted with a trend line.MACD itself has been used by traders to understand when the price of the asset they own will be bullish or bearish. MACD was created in 1979 by Gerard Appel. Which for years later, the indicator is favored by every trader around the world because of its ease and flexibility. Because, this indicator can also be used very well to see trends and momentum.
Therefore, MACD is often used by traders in the stock market, bonds, commodities, and foreign exchange. The concept of MACD can be said to be confusing, although its purpose and purpose are actually very easy to understand. Basically, MACD calculates the Exponential Moving Average (EMA) for the last 12 days and 26 days. EMA itself is a type of moving average that will emphasize the weight and significance of the most recent data.
Stochastic Bullish and Bearish
The Stochastic Oscillator or SO is categorized as an indicator for momentum. Technically, the role of this SO is to show the price at the last close, by calculating the difference between the lowest or highest price during the desired time span. SO itself consists of complex components so that its usefulness can be broader. The results of the measurements are not only based on the overbought and oversold levels.There are two oscillator lines that you should pay attention to in order to find a more confirmed sell signal and buy signal. The %K line acts as the main line, dubbed the signal line. Next to it, there will be a %D line or what can be called a trigger line, which is the average of the %K line. The two lines will intersect at a certain point.
The line cut that is heading upwards will be called the Golden Cross, with the interpretation being a signal to buy shares. Likewise, a sell signal will be present when a Death Cross occurs, which is a cross that is heading downwards. So, simply put, Stochastic is a stock indicator that will provide sell and buy signals through two intersecting lines.

Bullish and Bearish Engulfing
This Bullish Engulfing will be formed when there has been a downtrend pattern before and then at the end of the decline an Engulfing pattern will be formed which will result in an increase. The same concept can also be used in the bullish engulfing pattern, where the lower shadow limit for both the first and second candles can be used as a support limit, by referring to the lowest shadow in the position between the two candles.Likewise, for Bearish Engulfing it will be preceded by an uptrend pattern and at the end of the increase there will be an Engulfing which is indicating a decline or Bearish Engulfing. This Engulfing pattern can also be used to determine support and resistance in technical analysis, in the bearish pattern the end of the shadow is at the top for both the first and second candles which can be used as the resistance limit, for the benchmark you can choose the highest shadow between the two candles.
Bullish and Bearish Divergence
Bullish divergence, which can also be called convergence, is a market situation where the price has formed a lower low point. At the same time, the selected indicator will have a higher low position. This condition is the first signal that traders should bet on an upward rally. You also need to know that this indicator can be used to predict where a price is going.That way, if the divergence indicator moves up, it means that the price must also follow up. Meanwhile, Bearish divergence is a position when the price is creating a higher top on the market chart, while the indicator will provide a top or peak that can be lower. After a bearish divergence event occurs, usually the crypto asset will make a very fast bearish movement. So you should note that this pattern can also occur even though the previous price has the potential to be bullish.
Questions About Bullish and Bearish
Here are some questions that are often asked by traders, both beginners and experienced, regarding bullish and bearish itself. We summarize these questions below, namely:What is Bullish Continental?
Continental bullish is a bullish trend that is currently occurring in several groups of countries on a particular continent. Or it can be said as a group of companies that are optimistic about making a deal. For example, several insiders have secured larger positions in Irish Continental Group plc ( LON:ICGC ) shares over the past 12 months. This is reassuring because it has shown that insiders have increased their optimism about the company's prospects. While insider transactions are not the most important thing when it comes to long-term investing, the logic in determining yours is what should pay attention to whether insiders are buying or selling shares.What is a Bearish Trend?
As explained earlier, bearish is one of the trends that can occur in the capital market. For bearish itself is a sign of a decline in a stock price index as a whole. Investors very often use the term as a prediction or assumption that stock prices are going down. If this condition continues, investors will consider the option to sell shares so they can avoid losses.What is Strong Bullish?
Strong bullish is a strong bullish condition, with a long lower shadow so that it will indicate strong bullish activity towards the end of the range, indicated by a large red or large green candlestick. The origin of this strong bullish trend is called accumulation or demand zone.What are Bullish and Bearish Candles?
If the moving average chart is below, then it can be interpreted that the market is experiencing bearish. Likewise, the second indicator that can be used is the candlestick chart. In short, this candlestick chart can be seen by the color they have. If the candlestick is blue, then most likely the market is currently experiencing bullish.Likewise, if the candlestick is red, then the market is most likely experiencing a bearish trend. You can take advantage of these bullish and bearish conditions appropriately if you can understand all the conditions that are happening in the capital market when you are trading. Also understand all the cases that you can search for on the internet or the experiences of people around you or personally.
With this learning, you will immediately understand what conditions are happening to the instruments you invest in. After learning about what bullish and bearish are, make sure you take the right steps in trading by studying it more deeply through the Journal. You can find tips and tricks or other trivia learning that will help you learn trading. In addition, you can fill out the Trader Assessment survey for traders who want to consult with GICTrade.


