Last:
Last: 
Divergence is a condition that describes when the price and indicator are diverging or moving in different directions. Divergence itself has several types that you need to understand before trading. One of them is Hidden Bullish Divergence. In this article, we will discuss what Hidden Bullish Divergence means. Hidden Bullish Divergence is a type of trend that can occur on the capital market chart when you are trading.
This trend occurs when the price chart is in a higher low position, while the indicator is in a lower low position. For a more complete explanation of Hidden Bullish Divergence, you can read the article below. Additionally, you can fill out the Trader Assessment to consult about trading with GIC.
What is Hidden Bullish Divergence?
Hidden Bullish Divergence can occur when the price on the chart is in a higher low position, while the indicator is in a lower low position. These signs indicate that the ongoing bullish trend has the potential to continue. This setup occurs when the price forms a lower low (HL), but the oscillator (indicator) shows a lower low (LL). To remember this easily, you can think of them as a W shape on the chart pattern.
This happens during a retracement in an uptrend in Forex. The example below shows the Hidden Bullish Divergence setup, where the price makes a higher low (HL), but the indicator makes a lower low (LL). This chart shows a divergence signal between the price and the indicator. This signal suggests that the market's upward trend will soon continue . In other words, it indicates that the condition below is just a retracement in an uptrend.
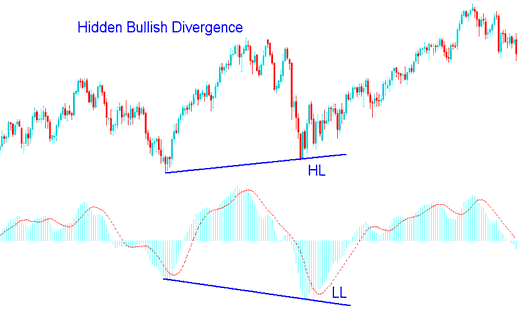
The chart confirms that the retracement movement is complete and shows the underlying strength of the uptrend. Before moving on to the discussion of Hidden Bearish Divergence, you can download app of the GIC Mobile from the Google Play Store or the App Store on your smartphone.
What is Hidden Bearish Divergence?
Hidden Bearish Divergence occurs when the price is at a lower high (LH), while the indicator is at a higher high (HH). This indicates that the current bearish trend is likely to continue. This setup happens when the price forms a lower high (LH), but the oscillator forms a higher high (HH).
To remember easily, think of it as an "M" pattern. This occurs during a retracement in a downtrend. The example below shows a setup where the price forms a lower high (LH) while the indicator forms a higher high (HH), indicating a divergence between price and indicator. This suggests the downtrend will soon continue . In other words, Showing this is just a retracement in a downward trend.
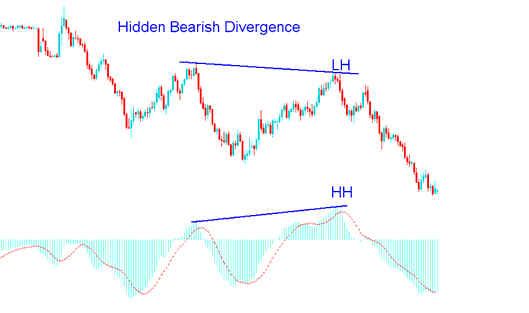
This confirms that the retracement has ended and the underlying strength of the downtrend remains intact.
Combining Both with MACD
A good indicator to combine with hidden divergence setups is the moving average, using the moving average crossover method. This will create an effective trading strategy.
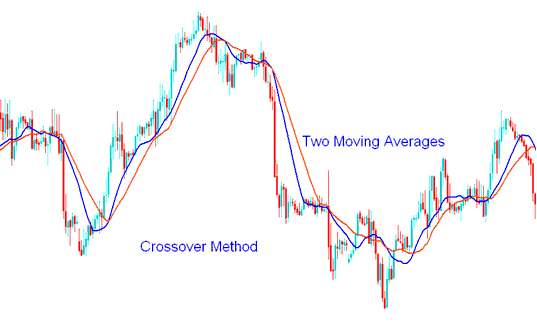
Moving Average Crossover Method in this strategy, after the signal is given, the trader waits for the moving average crossover to give a buy/sell signal in the same direction. If there is a bullish divergence setup between price and the indicator, wait for the moving average system to give an upward crossover signal. For a bearish divergence setup, wait for the moving average crossover to give a downward crossover signal.
By combining this signal with other indicators, traders can avoid mistakes while trading these signals. After learning about the Moving Average Crossover method, you can invite your friends to join GICAffiliate and earn extra income from the program!
Frequently Asked Questions about Hidden Bullish Divergence
Here are some common questions traders ask about Hidden Bullish Divergence.
What is Bullish Divergence?
A bullish divergence occurs when a price reaches a lower low while the technical indicator reaches a higher low. This signals strengthening market momentum and suggests that prices may soon rise to align with the indicator.
After a bullish divergence pattern, a quick price increase is common. Price charts showing bullish divergence are marked by successively lower lows in price candles while the oscillator’s signal line forms higher lows. Whether indicated by RSI bullish divergence or MACD bullish divergence, the principle for spotting and trading this pattern remains the same.
The only difference is that an RSI bullish divergence uses price troughs identified by a single signal line, while a MACD bullish divergence references the crossover points within the MACD indicator window.
You can spot bullish divergence when trading in capital markets. Additionally, to boost your income, consider the GICAffiliate program and become an IB, earning various bonuses from GIC.

What is Regular Divergence?
Regular divergence is generally used as an indicator of a potential trend reversal. If the price moves lower (forming a lower low/LL) while the oscillator forms a higher low (HL), this can be seen as a Regular Bullish Divergence, usually occurring at the end of a downtrend.
If the oscillator fails to form a new lower low, the price may move upward. Conversely, a price move forming a higher high (HH) while the oscillator forms a lower high (LH) is called a Regular Bearish Divergence.
Regular Bearish Divergence indicates that a rising trend may reverse. Regular divergence can be useful for those looking to identify tops and bottoms, helping to pinpoint areas where prices may stop moving in one direction and start reversing.
What is Hidden Divergence?
Divergence is not only a potential signal for a trend reversal, but it can also indicate a trend continuation. Remember, the trend is our friend, so whenever you get a signal that the trend will continue, it's certainly good news.
Hidden Bullish Divergence generally occurs when the price forms a higher low (HL) while the oscillator forms a lower low (LL), often seen in an uptrend. This setup appears when the price creates a higher low, while the oscillator shows a lower low.
Similarly, if the price forms a lower high (LH) but the oscillator forms a higher high (HH), this is called Hidden Bearish Divergence, which usually appears in a downtrend. Once you understand Hidden Divergence, feel free to take GIC's user survey to help us enhance our services.
How to Identify a Hidden Bullish Divergence Pattern?
As previously explained, there are two types of divergence you may encounter on cryptocurrency price charts: regular divergence and hidden divergence. Regular bullish divergence occurs when the actual price of a cryptocurrency shows a lower low compared to the higher low indicated by the oscillator. On the other hand, hidden divergence is the opposite of regular divergence, signaling that a downward retracement has ended and the trend is likely to continue. Hidden bullish divergence occurs when the actual asset price shows a higher low compared to the lower low indicated by the oscillator. This bullish divergence suggests an upcoming trend reversal or at least a retracement of the current downtrend.

What is Exaggerated Bullish Divergence?
Exaggerated Bullish Divergence is a condition where the price itself forms a double bottom or aligns with the previous low, while the indicator shows a higher low. This divergence happens when the price creates two low points on a relatively similar line, while the technical indicator diverges, forming the second low at a higher level.
In this scenario, there is a strong signal for a continued upward trend, making it ideal to hold or open new buy positions. Exaggerated bullish divergence is quite similar to regular bullish divergence, as both indicate a potential trend reversal, typically appearing at the end of a market trend. On the chart, the price support line (in black) is horizontal, while the indicator line (in blue) trends upward, signaling a shift to a bullish trend.
What is Bullish Divergence with Stochastic?
Bullish Divergence Stochastic refers to a bullish divergence using the stochastic indicator. During a bearish trend, when the price forms the first swing low (Lower Low) followed by a second swing low (Lower Low), and the Stochastic Oscillator forms a higher low pattern, then a Regular Bullish Divergence has occurred.

Regular Bullish Divergence Trading Rules :
- Chart pattern forms lower lows / bottom-to-bottom structure
- Indicator pattern forms higher lows
- Time frames: H4 and Daily
- Swing patterns are close together
- Presence of a bullish candle pattern or bullish trigger pattern
What is Divergence in Trading?
Forex divergence is defined as a case where the price of an asset moves in the opposite direction of a technical indicator, such as an oscillator. For example, the asset price may be rising, but the oscillator line moves in the opposite direction. The reverse can also happen in forex divergence. Let’s explore an example of forex divergence on the EURUSD chart.
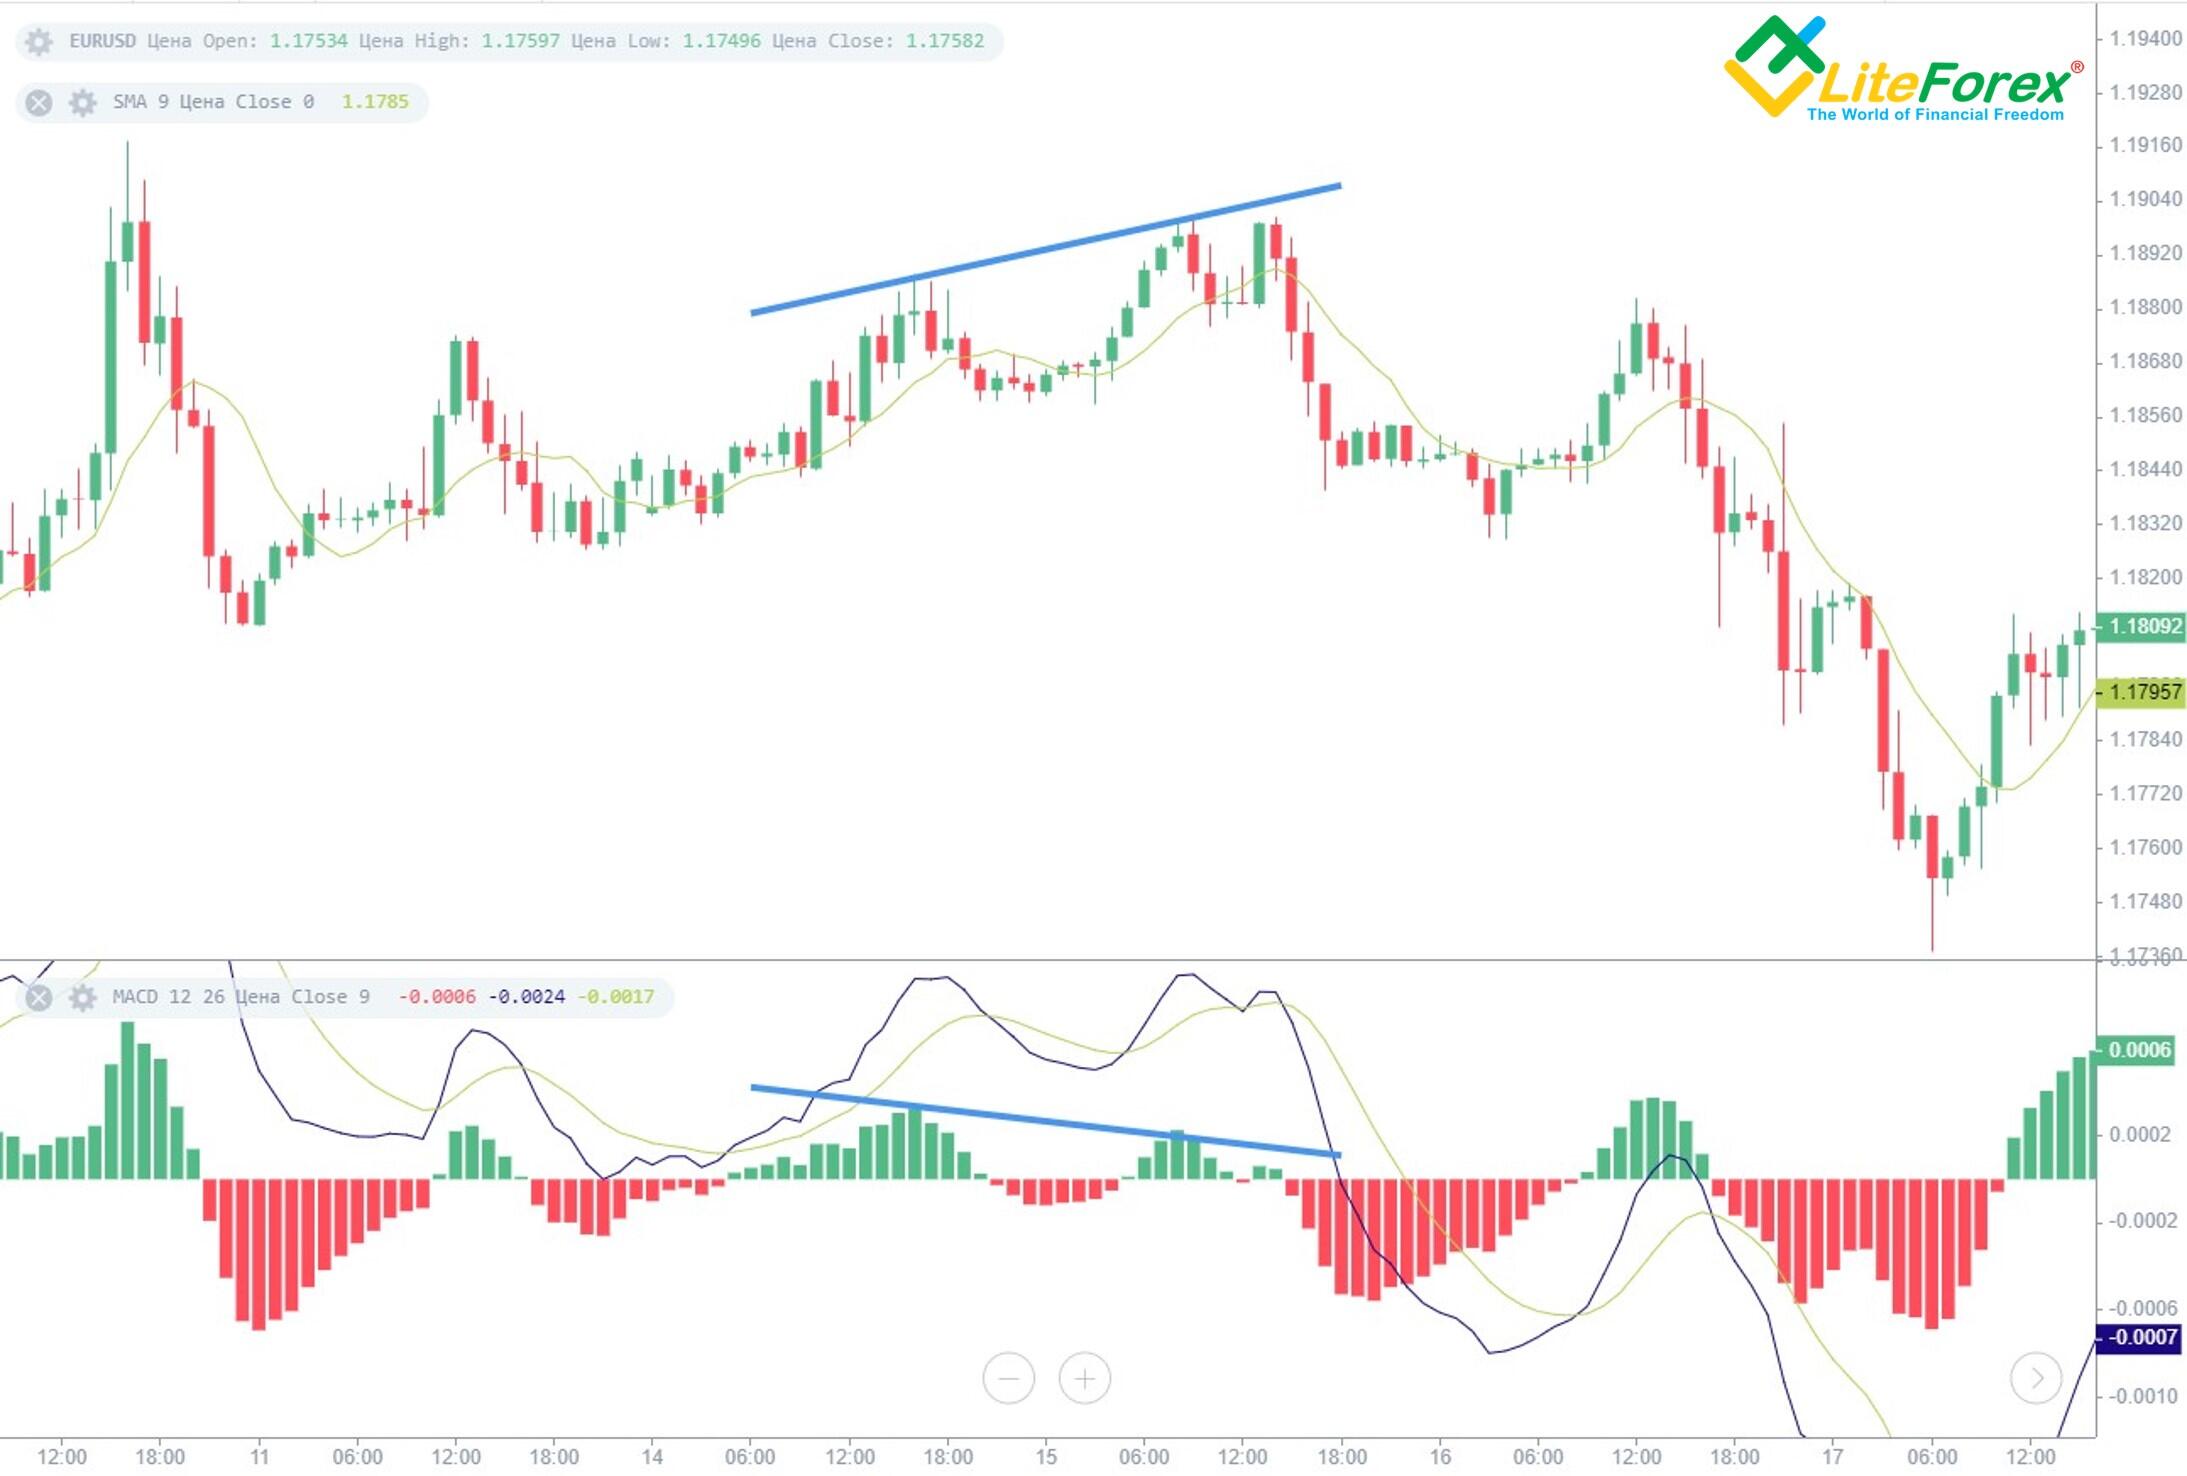
You can see from the chart that the next high, marked by a blue line, is higher than the previous high. Here, the MACD indicator is acting as a forex divergence indicator. However, the MACD shows a downward trend. You can observe the forex divergence histogram getting closer to zero. The signal becomes more accurate as the price begins to fall. This is a simple example of bearish divergence.
This divergence is also known as negative divergence. Negative divergence occurs when the underlying security moves to a new high, but the indicator fails to reach a new high, forming a lower high instead. Although divergence is a simple signal, many people find it confusing in forex trading. This can happen because of the numerous types and classifications of divergence itself. In general, divergence consists of the following types:
- Regular (simple) / hidden / extended
- Bullish / bearish
- Negative / positive
- Direct / reverse
- Divergence / convergence
Key Recommendations for Trading Divergence
Forex divergence is a fundamental type of early signal. Divergence can be easily identified in any market and on any trading instrument. The signal itself is universal, applicable to both basic strategy elements and as an additional filter. Any trader using technical analysis should understand how to use divergence signals. Here are the main takeaways and recommendations for trading divergence:
- A divergence signal alone is not enough to enter a trading chart. You should confirm it with technical indicators.
- If you are overwhelmed by various types of divergence, focus on mastering the main type—regular divergence. Regular divergence will help you identify trend reversals and guide entry points at trend tops or bottoms.
- Ensure you correctly spot the differences. Cross-check with a checklist, and review common mistakes when trading divergence.
- Consider multiple or accumulated signals when analyzing divergence.
- Divergence observed over a longer period can add meaning to shorter-term divergence.
- Convergence-divergence signals in forex will look similar across all platforms, enabling you to trade divergence in any market.
- There is no universal indicator specific to divergence. You can experiment with forex divergence signals by testing various combinations of technical indicators. However, avoid unjustified risks. Test any strategy on a demo account.

After learning about Hidden Bullish Divergence, be sure to also understand how to handle divergence conditions in real-time scenarios. You can study various indicators, as mentioned above, through advanced classes or GIC trivia to maximize your trading.
Since this signal is simple, you can focus on learning Hidden Bullish Divergence thoroughly so that when you encounter such conditions, you can quickly decide your next trading move. Additionally, you can test your trading skills using GIC’s Preliminary Test to assess your trading abilities.