 Last:
Last: 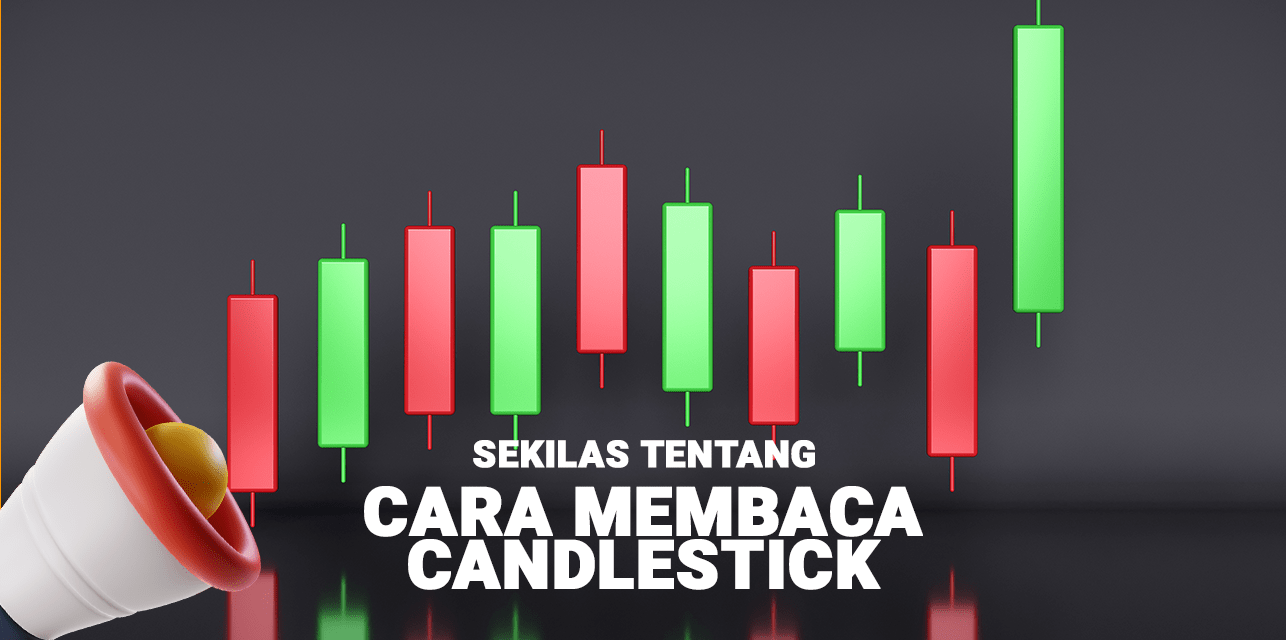
Forex Candlestick Explanation
Forex candlestick formations or price patterns are used by traders as entry and exit points when in the market. It can also be said that forex candlesticks are used as part of a technical analysis to analyze the current market. Individual forex candlesticks will form candle formations, such as Hanging Man, Hammer, Shooting Star, and other candle formations. For this forex candlestick chart, it will form various price patterns such as triangles, slices, and also head and shoulders patterns. These candle patterns and formations can also be used in all trading matters such as equities (stocks) or cryptocurrencies. Unlike the basic price action chart in trading, this forex candlestick is a simple and clearer chart, so it does not require special calculations and directly shows whether the price is increasing or decreasing. Plus the introduction of price charts marked with color, which will make it easier for us when reading the chart.How to Read Candlesticks in Forex
Forex candlesticks in modern technical analysis are a type of interval chart and also a technical tool. This forex candlestick chart is also often referred to as a combination of intervals and line charts in the sense that each of its elements will display a range of price changes during the period that occurs at that time. A forex candlestick will consist of a body that has a white or black color, and also a shadow above or below which is also commonly referred to as an axis.
For the upper shadow and also the lower shadow, this will indicate the high or low price at the appropriate time period. For the top or bottom of the candle body, this will indicate a price when you can open or close. If the price rises in total, namely when the closing price is higher than the price at the time of opening, then the candle body will be white (later it will be light or also hollow).
As for the lower part of the body, it will reflect the price at the time of opening and the upper part will reflect the closing price. If later the price has decreased, then the position is that the candle closes lower than when it was opened, with its body being black (filled or only dark). The top of the candle will mark the opening and the bottom will mark the closing.
A trader can determine whether the price will rise or fall during a certain period of time by tracking the color changes in the body of the candle as briefly explained above. The white, green, or transparent color of the candle will indicate a price increase. While the black or red color will indicate that there is a price decrease. The colors of the candle will depend on the settings that have been applied. Here is how to read a candlestick. Before continuing to the 4 candle prices, register yourself as an IB affiliate or invite friends and get additional income when inviting referrals.
Viewing 4 Prices on Candle
There are 4 prices that you should pay attention to regarding candles to be able to determine when each data point occurs. The 4 prices are:- Opening Price or what is usually called the opening price is a term for the first price that is usually traded during a certain period of time, which will be indicated by the presence of a part at the bottom of the body of a candle that has a green color or at the bottom of the body of a candle that has a red color.
- High Price (High) which is the highest price that exists during a certain period of time. Usually this highest price will be indicated by the top of the wick or tail that is above the body.
- Low Price (Low) which is the lowest price during a certain time period. This will be marked by the lowest price shown through the bottom of the wick or the tail that is below the body.
- Closing price is the last price traded at a certain time period, and this is usually marked either at the top of the green candlestick or at the bottom of the red candlestick.
Viewing Candle Sizes on Forex
This candle size element can help you to know who is in control of the price chart, both the buyer trader and the seller trader. The bigger or longer the size of a candlestick, the stronger the position of the trader. However, on the contrary, if the size of a candlestick is smaller, it will indicate that the trader cannot move the price too high.The Meaning of Red and Green Colors
For those of you who don't know what the red and green colors mean on a candlestick, here is an explanation of the two colors:- The green candlestick itself will indicate that later the buying traders will take full control of the market. The longer the candlestick, the more it can show a very large buying interest. If you are looking at a candlestick with this green color, it means that the market tends to be heading towards the positive side and the buyers themselves are in power in the formation of the candlestick.
- The red candlestick will later indicate that the seller traders will later take full control of the market. The longer the size of the candlestick itself, the greater the selling pressure will be. If you are looking at this red candlestick, it means that the market tends to be heading towards the negative side and the seller himself is in power in the formation of the candlestick.
Axis Length and Axis Direction
The length of the axis along with the direction of the axis will later inform you about the volatility of the price movement in your forex trading. The information provided is:- If the wick is long, it will indicate that the price moved quickly during the duration of the related candlestick, but will experience rejection due to rejection and resistance.
- And if the axis is getting longer, then this indicates that the volatility of a price movement will increase. This often happens at the end of a trend, before the price reverses direction, or when the price approaches a very important support resistance.
Body Length and Axle Ratio
The length of the axis and the direction of the axis will greatly affect your trading chart. Therefore, you need to know the following:- A long candlestick will show a meaning, the longer the candlestick, the greater the buying and selling interest, depending on the color displayed.
- Small candlesticks themselves mean that they will indicate that traders who are buyers or sellers cannot move the price too far or close at the time of the opening position. When there is a small candlestick, there will be a very fierce price battle between buyers and sellers. Which will make the market very uncertain, so that traders usually do not have a clear direction. If you see a candlestick with this type, then you should wait and also not enter the market first before there is a clear signal about which direction the price will move.
- Candlesticks with small bodies and tails that extend downwards will indicate that buying traders will be able to put up a very big fight. Selling traders themselves will have time to take control by pushing the price down before finally buying traders will put up a big fight by lifting the price back to around the opening level. If you are encountering a candlestick like this, and you are finding this candle in the support area, then this will indicate that there will be a reversal in the market.
- Candlesticks with small bodies and tails that extend upwards will indicate that the selling traders are putting up a big fight. Buying traders will have time to take full control by raising the price before the selling traders can put up a big enough fight and finally push the price back down to around the opening level. If you are finding a candlestick like this detail, and you are finding it in the resistance area, it will indicate a reversal in the existing market.
- The last wick length of these types is a candlestick that has a small body that is between two long tails. This wick will indicate that both the buying traders and the selling traders will each have a balanced power in controlling prices in a market, so neither of them is a winner or a loser in the market. If you are looking at the type of candlestick as explained here, it means that the market is experiencing indecision, namely the traders themselves will look confused. Because this candlestick pattern if it looks in a group, it can be interpreted that the market is experiencing sideways or flat.
Candlestick Body Position in Forex
For the position of the candlestick body, this is a development of the previous element, namely, the ratio of the length of the body and the wick. So the position is:- If you find a candlestick that has a long wick with the body positioned at one end, then this indicates resistance, as explained in the ratio of the length of the body and the wick.
- Meanwhile, for candlesticks with a body position that is in the middle of the lower and upper axes, it will indicate doubt or uncertainty in the existing market.
Various Candlestick Patterns in Forex
If we discuss patterns, then there will definitely be many types. Including candlesticks which also have many patterns. For those of you who do not know the various patterns of candlesticks, then this time we will discuss and learn about these various patterns. The types of candlestick patterns are:Single Candlestick Patterns
For the pattern of this single candlestick, it will also be divided into several more patterns. There are seven patterns. These patterns are:Spinning Top
For the size of the Spinning Top itself, it will have a small body size, but the shape of the axis (shadow) at the top and bottom will be elongated. This is because there is uncertainty among the market players themselves. Therefore, the chart pattern will be considered a neutral chart pattern, because in the time period that occurs there is a deadlock. If this spinning top pattern appears during an uptrend, then there will be many market players who can take profit from this incident itself, and vice versa.Marubozu
This Marubozu pattern means a candlestick that has a bald head. This candlestick does not have a wick or shadow which has caused the naming of this Marubozu. Marubozu itself will indicate a signal of strong movement from the side of a market player who wants to carry out a sale or purchase activity. The accuracy of this Marubozu signal will be very high which even has the possibility of lasting for several very long periods. The signal from this Marubozu can indicate a bullish or bearish condition, which will depend on the price position and also the close of a candle. In a bullish Marubozu, the price at the time of closing will always be higher than the price at the time of opening, and the candlestick will not have a wick at all. While for the bearish Marubozu itself, the price at the time of closing will always be lower than when the price was opening with no wick.Doji
This doji candlestick pattern is not much different from the spinning top candlestick pattern, but this pattern will be slightly more complex when compared to the spinning top type itself. This Doji is almost invisible to have a body, which can make the Doji indicate a phenomenon of the inability of market players, both from the side of buyers and from the side of sellers in holding control later. So it can be concluded that the doji candlestick itself is a pattern when the price of a commodity or stock is experiencing a consolidation event. Which will require market players to wait, observe, and observe this type of candlestick the next day.Hammer
As the name suggests, hammer itself means hammer. Which means that this candlestick pattern does have a shape like a hammer. This hammer pattern itself has a small body, and also has a long axis that will point down. This pattern will indicate a bullish signal when market conditions are experiencing bearish or a price reversal from falling to rising. You also need to remember, the indication that needs to be considered when taking buy action when seeing this type of candlestick pattern is by paying attention to the length of the lower shadow, whether it has a length of two or three times the size of the original candle body or not. And also pay attention to the upper shadow of this candlestick pattern. The hammer pattern will usually have an upper shadow that should be very small and usually not visible at all or does not exist.Hanging Man
This pattern is the opposite of the hammer pattern that we discussed earlier. Its shape will be similar to the hammer pattern at first glance, a small body and a long downward axis. However, this hanging man usually appears only when an uptrend occurs. Not only that, unfortunately the accuracy of this hanging man itself is very low. So if you find this type of candlestick pattern, you should not rush to take the next step. You have to wait for the close position on the next candle. If the close price on the next candle is indeed low, then it can be confirmed that the market is experiencing a bearish reversal tendency.Inverted Hammer
This Inverted Hammer is an inverted hammer pattern. For this inverted hammer pattern itself, it will be the same as the hammer pattern that we have previously discussed, but the difference lies only in the axis that is at the top and will only occur when conditions are experiencing a downtrend. When looking at the axis, this signal is a bullish signal because market players are making purchases, but there is great pressure from those who are taking profit. However, this could actually be a sign that a bullish event will occur later.Shooting Star
This Shooting Star is a pattern that is almost the same as the inverted hammer pattern, but its position is when an uptrend event occurs. Shooting Star itself has a long upper shadow shape and also a body that is filled with facing down. Therefore, the pattern of this candlestick will be the same as its name, namely Shooting Star or commonly called a shooting star. This can also be a sign that the stock price or a commodity is entering a downtrend. Regarding the accuracy signal, this shooting star has an accuracy signal that can be said to be moderate.Double Candlestick Pattern
For the next pattern, there is a double candlestick pattern which is also divided into several more candlestick patterns. The types of double candlestick patterns are:Bullish Engulfing
The naming of this pattern comes from the events that occur and arise from the nature of the bull that Engulfs the bears. You need to know and remember that the term bull is for buyers and bear is for sellers. For bullish engulfing candles will give a signal about the occurrence of an uptrend. When there is a bearish candle that is immediately followed by a larger bullish candle. This is because the bulls or buyers are stronger than the bears or sellers. The accuracy of this bullish engulfing is moderate.Bearish Engulfing
While bearish engulfing, from the name it can be seen that this pattern is the opposite of the previous pattern. This bearish engulfing will later indicate the occurrence of a downtrend event. What needs to be noted from this bearish engulfing is that for a larger bearish candle, it will later follow a smaller bullish candle. With the reason, the sellers are able to hold back the pace of the buyers.Tweezer Bottom and Tweezer Top
This tweezer bottom will be seen when a downtrend occurs. This tweezer bottom will have a shape like a hammer pattern that has a long and downward axis. However, the right and left sides are bearish and bullish candlesticks. Which means, this pattern will indicate a signal with a rising price. In addition, there is a tweezer top pattern that has a pattern like a shooting star that will indicate the opposite of the tweezer bottom. When a bullish candlestick meets a bearish candlestick when an uptrend occurs with a wick line that points upwards and has a long shape. With a price that has risen but cannot hold strong so that it bounces down again. Keep in mind that tweezer bottoms and tops do not have to have the same body, but must have the same high value.Harami
For this pattern, the candlestick on the left side will have a larger body than the right side. Therefore, this pattern is called the Harami pattern which means pregnant. For the smaller right candlestick, it will indicate that the trend will soon change. The smaller the candlestick on the left, the stronger the potential for changes in the trend.Triple Candlestick Pattern
Next, there is a triple candlestick pattern consisting of three other types of patterns. Before knowing these patterns, don't forget to take a preliminary test to measure your trading skills. Next, these patterns are:Evening Star and Morning Star
When a doji candlestick appears between two candlesticks that have long bodies, it is a characteristic of the Evening Star or Morning Star pattern. This Morning Star candlestick pattern has a bearish candlestick arrangement followed by a doji then a bullish candlestick and occurs when there is an event where the chart position experiences a downtrend. This pattern indicates the time to carry out a buy action or a bullish reversal. Likewise, the evening star candlestick pattern will occur when there is an event where the chart position experiences an uptrend, signaling that it is time to carry out a buy action or a bearish reversal. The formation is a bullish candle followed by a doji then a bearish candle.Three White Soldiers and Three Black Crows
The Three White Soldier and Three Black Crows patterns are usually used to confirm the strength of the current direction and trend. The Three White Soldier pattern is formed from three long bullish candles and follows a downtrend with the function of ensuring a bullish condition. Plus when it appears after a prolonged condition in a short period of price consolidation. It should also be noted that the second candlestick or the one in the middle must have a small tail or even none at all. While the Three Black Crows pattern is the opposite of the Three White Soldier. This pattern will form when there are three bearish candlesticks that follow a strong uptrend event, and also indicates that a reversal will soon occur.Three Inside Up and Three Inside Down
These two patterns will indicate a trend reversal, namely a bearish pattern followed by bullish and followed by bullish again, for the Three Inside Up pattern. And also a bullish pattern followed by bearish and followed by bearish again, for the Three Inside Down pattern. In the Three Inside Up pattern, it will occur after the latest downtrend event which is a signal for an uptrend reversal, namely a price reversal from decreasing to increasing. While in the Three Inside Down candlestick pattern which is the opposite of Three Inside Up. This pattern is an indicator for a downtrend reversal, namely, a price reversal from increasing to decreasing, which occurs by following the latest uptrend.Reversal Candlestick Patterns
And finally, there is a candlestick reversal pattern which also consists of three patterns. These patterns are:Three Line Strike
This candlestick pattern can be said to be a pattern that is very rarely found. However, when this candlestick pattern appears, it could be an indication of a reversal that will be very accurate. For Bullish Three Line Strike, it tends to indicate a reversal event towards the bottom or bearish reversal. Because the pattern is indicating a bearish reversal, this candlestick pattern is usually formed into a series of rising trends or uptrends. While for Bearish Three Line Strike will provide a pattern that you can use when marking a bullish reversal. Bearish Three Line Strike will form in a series of declining trends or downtrends. In the three series of candles, the composition must consist of bearish candles.Two Black Gapping
As the name implies, this pattern has a main characteristic in the form of a fairly large and wide gap between the first and second candles. This pattern usually appears when there is a series of uptrends, before the trend finally ends due to the formation of a bearish candle with the next candle that follows, namely a bearish candle. With the presence of an OHLC level that is lower than the first candlestick, which causes a gap down to form. Therefore, you will know that the price will experience a trend reversal towards a bearish reversal.Abandoned Baby
Next, there is the Abandoned Baby which indicates a bullish reversal or bearish reversal, depending on the position where this pattern is formed. The characteristic of this pattern is that the second candle will be in the form of a Doji candle with a gap between the two candles, namely on the first and third candles. In the case of Bullish Abandoned Baby, the one that acts as a confirmer of the doji candle is the third candle that has a bullish shape. This can indicate that buyers have succeeded in outperforming a seller and are ready to bring the price to an uptrend.After knowing all types of patterns from this candlestick, you can also find other information about other chart patterns such as pennant, triangle, head and shoulders, and many more. You can also learn how to use these chart patterns and what are the benefits of the pattern itself. Thus the discussion and also information from GICTrade about the explanation of "Types of Candlestick Patterns in Forex and How to Read Them".
And for those of you who want to find information or other things about chart patterns, stocks, or other things about forex and finance, you can find trivia information in the GIC Journal, such as "Bullish Pennant: Definition, Pattern, to Trading Method". It is also necessary to ensure that you deepen your forex knowledge on the GICTrade platform, through the scalping ebook and NFP live trading provided by GICTrade itself. In addition, you can also download the GIC Mobile application, either on the Google Play Store or the Apps Store.


