 Last:
Last: 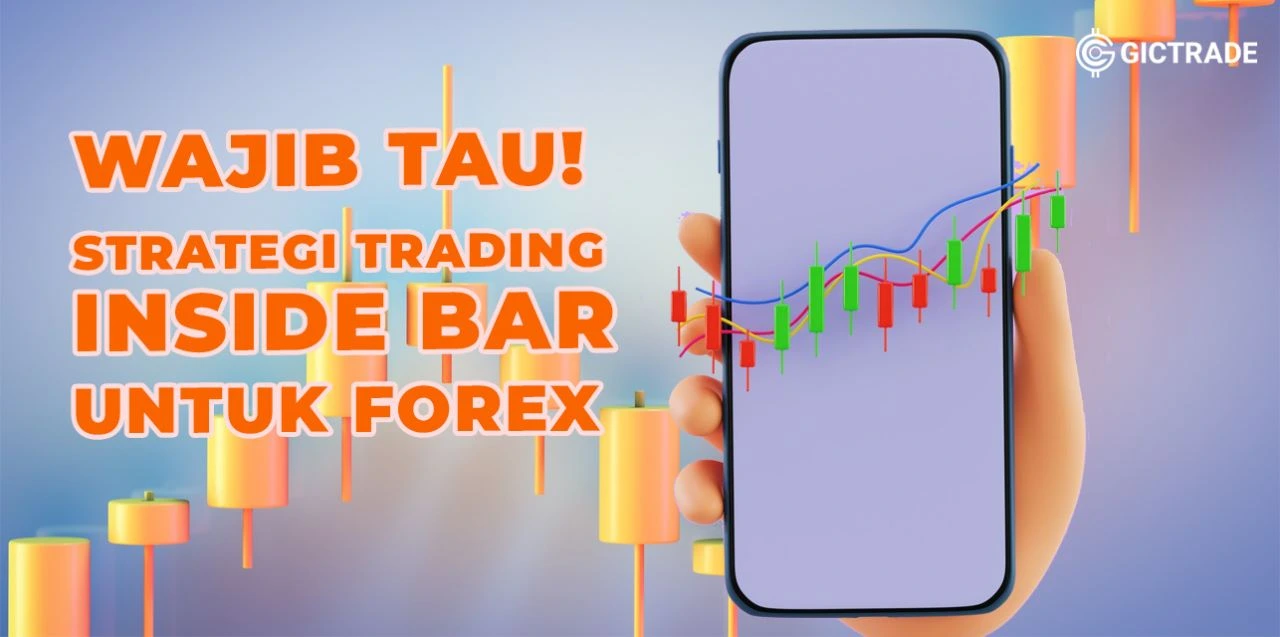

Inside Bar Candle Is
The “inside bar” pattern is a two-bar price action trading strategy where the inside bar is smaller and in the high-to-low range of the previous bar, i.e. the high is lower than the high of the previous bar, and the low is higher than the low of the previous bar. Its relative position can be above, in the middle or below the previous bar. The previous bar, the bar before the inside bar, is often referred to as the “mother bar”. You will sometimes see the inside bar referred to as the “ib” and the mother bar referred to as the “mb”. Some traders use a more lenient definition of an inside bar which allows for the high of the inside bar and the mother bar to be the same, or for the low of both bars to be the same. However, if you have two bars with the same high and low, it is generally not considered an inside bar by most traders. Inside bars indicate a period of consolidation in the market. A daily chart inside bar will look like a ‘triangle’ on a 1-hour or 30-minute chart time frame. They often form following a strong move in the market, as it ‘pauses’ to consolidate before making the next move. However, they can also form at market turning points and act as reversal signals from key support or resistance levels.Studying Bullish Pin Bars and their Characteristics and Examples
How to Identify Inside Bars on Forex Charts
The following steps are used when identifying inside bar patterns on forex charts:- Identify previous trends using price action / technical indicators
- Find the inside bar pattern where the inside bar is completely engulfed by the previous candle's high and low.

Trading With Inside Bar Candlestick Pattern: Top Tips And Strategies
Some traders consider it a continuation pattern although a breakout in the opposite direction is also possible. After price has been trending up (or down) for an extended period of time, a pause in price movement (represented by the inside bar) precedes a trend reversal. Therefore, inside bars are looked at for short-term trading (or swing trading) in a counter-trend direction with the goal of holding the trade for less than 10 bars. However, there is another way to trade inside bars and it stems directly from what the candlestick pattern does NOT reveal. When traders see an inside bar pattern forming, it is interpreted as the market’s reluctance to push price higher or lower. This could be for a number of reasons:- A highly relevant report will be issued soon, or
- The market has just made a stratospheric jump and traders are hesitant to bid prices much higher or lower.
Inside Bar breakout strategy As mentioned earlier, inside bars represent short-term consolidation periods of low volatility in a trending market. Traders then look to trade breakouts once a new high/low is established. In the EUR/GBP chart below, the previous trend is seen by the lower low and lower high. The breakout occurred below the low of the ‘previous bar’ thus triggering a short entry into the market. Had this breakout occurred above the high of the ‘previous bar’ then this could have signaled a long (buy) entry indicating a potential trend reversal. Trading against the trend carries more risk which leads to greater caution being taken by traders.

Stop levels can be taken from previous swing highs/lows (depending on the trend) as determined by key price action levels. Using the stop as a benchmark, the trader can use this stop distance to extend by a factor of two to realize the take profit (limit) level. This creates a 1:2 risk reward ratio in line with responsible risk management. Fibonacci extensions can also be used as an approximate limit.
Price Action Trading: Functions, Indicators, Methods, and Strategies
Types of Inside Bars
Below are the types of inside bar candles.

-
- Inside Bar With Small Range This bar is a standard inside bar where the candle range is small and covered by the previous candle. This type of bar indicates indecision and low volatility in the market. inside bar with small range

- Inside Bar With Wide Range In this bar, it will be seen that the inside bar is too wide. This will indicate indecision or market reversal. Inside bar with bullish closing will show signs of strength as shown in the image below.
- Inside Bar With Small Range This bar is a standard inside bar where the candle range is small and covered by the previous candle. This type of bar indicates indecision and low volatility in the market. inside bar with small range

The large inner blade with a small body and showing signs of hesitation can be seen in this image.

- Multiple Inside Bar Is the most powerful pattern because it will show volatility in the market. Volatility in the market moves from low to high. So when there are many inside bars we must be ready for big movements in the market.
Insert image type 3
1. Identify Potential Breakouts As They Develop
When an inside bar develops, it signals a consolidation that could see an impending breakout in the near future. However, in order to capitalize on this potential breakout, you need to identify whether the breakout is likely to result in price appreciation or depreciation. One way to do this is to look at the price trend up to that point. One of the most useful characteristics of a profitable inside bar setup is that the price action continues the trend prior to the development of the inside bar. If a pair’s price was already trending up before the consolidation period marked by the inside bar, the breakout is likely to continue that trend. Based on the trend of the pair’s price action, you should also consider the potential risk/reward of any given trade. Generally speaking, your risk should be less than half of your potential reward, meaning an inside bar setup is only profitable when its trend, its relationship to existing resistance lines, and other chart indicators point to strong breakout potential. To evaluate this risk/reward ratio, you may want to consider other technical indicators and chart patterns that you routinely use in your trading analysis. While some traders are strong advocates of the inside bar as a reliable indicator, most traders will likely want to use other chart patterns and technical indicators to evaluate potential price action. Using these other indicators can give more credibility to the indications coming from the inside bar. Keep in mind that, while the inside bar may represent the calm before the storm, you will be able to profit only if you can reliably evaluate these trades to determine what kind of position you should open.2. Tread Lightly When Trading Inside the Bars Below the Daily Chart
Inside bars are most valuable when you’re looking at daily charts because they offer a larger sample size of price action on a given asset. On smaller time frame charts, such as the one-hour or four-hour chart, inside bars are fairly common and aren’t always a reflection of ongoing consolidation. If you can back up a short-term inside bar with a strong chart pattern or other technical indicator that suggests a short-term move, it may be worth taking a position. Be aware, however, that when you’re evaluating data from a smaller time frame, the validity of your inside bar evidence isn’t as strong as you might expect from a daily chart.3. Track Consolidation from One Day to the Next
The best use of the inside bar as a technical indicator is on the daily chart. The inside bar illustrates that consolidation has occurred throughout the trading day, indicating that the contracting range is about to widen and become more volatile. To help identify the direction in which price may breakout, always consult the daily bar trend as well as Fibonacci retracements and other applicable chart patterns and technical indicators. Traders should enter a position while price is still within the range defined by the inside bar or when price breaks just above the upper level of the inside bar. By waiting for price action to move quickly in one direction, you have already sacrificed most of your potential profits.4. Always Place a Stop-Loss Order
Inside bars are valuable indicators for breakouts, but traders can never guarantee that price will break out as they predict. A stop-loss order should always be placed on any trade that relies on an inside bar to identify price consolidation. When buying, place a stop-loss order just below the bottom of the inside bar. Since inside bars essentially represent a tug-of-war between bears and bulls, traders should expect that the bears will win some of those battles. Setting a stop-loss order will help you minimize those losses, preserving your profits from when your prediction comes true.Advantages and Disadvantages of Inside Bar Trading
Traders who frequently turn to inside bar trading are usually those who build their strategies around price action trading. By taking positions based on breakout and momentum indicators, even novice traders can use inside bar trading, among other price action indicators, to identify trading opportunities that can yield quick profits. Inside bar trading is also relatively easy to use when analyzing trading opportunities. Because this approach works best on daily charts, you only need to check your charts once a day for inside bar opportunities. For some traders, this can take a few minutes a day to find potential trades and set pending orders. However, like any chart pattern, inside bar trading is not perfect. It is not as reliable when applied to shorter time frames, which can make it less effective for day trading and intraday trading. Inside bars are more common on these shorter time frames, so traders who look for inside bars tend to get a lot of “false positives” when looking for potential breakouts. And even when inside bars do show a breakout, there is no guarantee that the price action will come to fruition. On the EUR/JPY chart below, for example, the development of the inside bar on September 14 indicates a period of consolidation for the currency pair. But instead of breaking through to a quick rally, the pair fell for seven days:
This price reversal occurred despite the pair being on the rise, showing some signs of a profitable setup. The risk of a price reversal should be taken into account whenever you trade an inside bar. This is why stop-losses are essential to building a sustainable trading strategy.
Become an Expert Using Various Candles
Do you know that trading requires an understanding of reading the market, strategies and trend analysis. This understanding cannot be obtained instantly. The key to trading is patience, therefore there are no instant results. Choose a trading platform that can support you in trading. Choose a transparent platform so that you feel safe in trading. GICtrade is here to be a solution to the many illegal brokers circulating. GICtrade gathers trusted brokers for those of you who want to start trading. Register immediately to get a trading experience at GICTrade!


