The Exponential Moving Average that we will discuss this time is one of the types of moving averages or MA that will place greater weight and significance on the most recent data points. In addition, EMA has another name, namely weighted moving average. For more details about this EMA, you can read the article post below. However, make sure to fill out the internal survey from GIC so that our platform can continue to provide better service.
Table of Contents
- What is Exponential Moving Average (EMA)?
- EMA Lines in Stocks
- Exponential Moving Average Formula
- EMA Types
- What is the 20 EMA Line?
- How to Set Exponential Moving Average
- Step #1: Plot on your chart the 20 and 50 EMA
- Step #2: Wait for the EMA crossover and price to trade above the 20 and 50 EMA.
- Step #3: Wait for the zone between the 20 and 50 EMA to be tested at least twice, then look for buying opportunities.
- Step #4: Buy in the market when we retest the zone between the 20 and 50 EMA for the third time.
- Step #5: Place a protective Stop Loss 20 pips below the 50 EMA
- Step #6: Take Profit after we break and close below the 50 EMA
- How to Use Exponential Moving Average
- EMA Example
- Does Exponential Moving Average give Profit
- Difference between Weighted Moving Average and exponential moving average
What is Exponential Moving Average (EMA)?
The Exponential Moving Average (EMA) is similar to the Simple Moving Average (SMA), measuring the direction of the trend over a period of time. However, while the SMA simply averages the price data, the EMA places more weight on more recent data. Because of its unique calculation, the EMA will follow price more closely than the corresponding SMA. The exponential moving average (EMA) is a calculation of the average price over a period of time that places more weight on the most recent price data, causing it to react more quickly to price changes.
Traders use moving averages on charts to help determine trends, direction, and strength, and are often used as entry and exit points. A moving average is essentially a measure of the average price of a security obtained by averaging its price over a period of time. Traders often use moving averages to gauge market trends to increase their chances of success and trade in the direction of the market.
Moving averages are also useful for identifying support and resistance levels. They also allow traders to see past performance and provide a glimpse of where the stock price is likely to move in the future.
EMA Lines in Stocks
EMA is basically used for analysis and as a trading indicator in the stock market. The slope in the EMA chart indicates the uptrend or downtrend of a stock. The best way to assess the likelihood of a stock price reversal is to compare the exponential moving average (EMA) and the simple moving average (SMA) on the price chart.
The point where the long-term SMA and short-term EMA intersect is when the recent price trend reverses. The 50-day EMA, 100-day EMA, and 200-day EMA charts provide resistance and support levels for the stock. The resistance level is the point where the stock price starts to rise, while the support level is the point where the stock price starts to fall. When the price breaks through the trendline, this is the most optimal time to enter a trade. By breaking down each section;
Many traders watch these support or resistance points closely and enter a trade as soon as the price breaks the trend line or bounces against it and reverses direction. Before continuing with the exponential moving average formula, be sure to take a preliminary test and measure how far your understanding of trading itself!
Also read :
The point where the long-term SMA and short-term EMA intersect is when the recent price trend reverses. The 50-day EMA, 100-day EMA, and 200-day EMA charts provide resistance and support levels for the stock. The resistance level is the point where the stock price starts to rise, while the support level is the point where the stock price starts to fall. When the price breaks through the trendline, this is the most optimal time to enter a trade. By breaking down each section;
- Interpreting the EMA essentially requires the same rules that apply to the SMA. Considering that the EMA is significantly more sensitive to price movements. This can be both good and bad. On the one hand, the EMA can help you identify trends earlier than the SMA. On the other hand, it may experience more short-term variations than the corresponding SMA.
- Utilizing the Exponential Moving Average (EMA) to determine the trend direction, one can direct their trades in that direction. One should consider buying a stock when the EMA is rising and the price is falling just below the EMA or near it. Conversely, sell a stock when the EMA is falling, and the price is rallying near the EMA.
- As mentioned earlier, Moving averages also show areas of support and resistance. A rising EMA tends to support price action, while a falling EMA tends to provide resistance to price action. This supports the trading strategy of buying stocks when the price approaches the rising EMA and selling stocks when the price approaches the falling EMA.
- Moving averages, including EMAs, are not designed to identify exact bottoms and tops in trades. They may help in the general direction of a trading trend, but with a delay in entry and exit points. However, EMAs have a shorter delay than SMAs over the same period.
Many traders watch these support or resistance points closely and enter a trade as soon as the price breaks the trend line or bounces against it and reverses direction. Before continuing with the exponential moving average formula, be sure to take a preliminary test and measure how far your understanding of trading itself!
Also read :
Exponential Moving Average Formula
The Exponential Moving Average formula is: EMA = (previous day's closing price EMA) × smoothing constant + previous day's EMA where the smoothing constant is: 2 (number of time periods + 1)
Before you can start calculating an exponential moving average, you need to be able to calculate a simple moving average, or SMA. Both SMAs and EMAs are typically based on a stock’s closing prices.
To find a simple moving average, you calculate a mathematical average. In other words, you add up all the closing prices in your SMA, and then divide by the number of closing prices. An exponential moving average (EMA) reduces lag by applying more weight to recent prices. The weighting applied to recent prices depends on the number of periods of the moving average.
An EMA differs from a simple moving average in that the calculation of a given day’s EMA is based on the calculation of the EMA for all the days prior to that day. You need more than 10 days of data to calculate a reasonably accurate 10-day EMA. There are three steps to calculating an exponential moving average (EMA). First, calculate a simple moving average for the starting EMA value.
An exponential moving average (EMA) has to start somewhere, so the simple moving average is used as the previous period’s EMA in the first calculation. Second, calculate the weighting multiplier. Third, calculate the exponential moving average for each day between the initial EMA value and today, using the price, multiplier, and the previous period's EMA value. The formula below is for a 10-day EMA.
EMA Types
Here are the types of Exponential Moving Average that you need to know. There are 2 types, namely:Double EMA
Double Exponential Moving Averages (DEMAs) are an improvement over Exponential Moving Averages (EMAs) because they allocate more weight to the most recent data points. The reduced lag results in a more responsive moving average, which helps short-term traders spot trend reversals quickly.
The double exponential moving average was developed by Patric Mulloy in 1994. It appeared in an article that appeared in Stocks & Commodities magazine.
In it, the article suggests that the common moving average is not as accurate in providing trading signals. The article attributes this to the lag factor since the indicator uses historical data.
To solve this, the article suggests using mathematical calculations to eliminate the lag in the exponential moving average. And as we wrote earlier, the first step in calculating the EMA is to find a simple moving average .
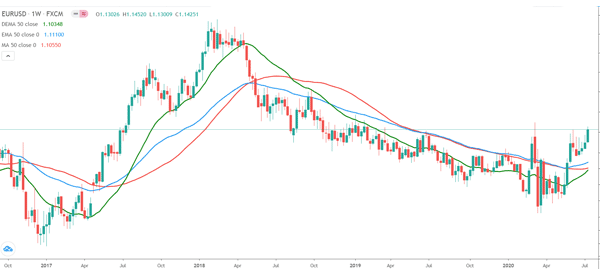
The chart below is a daily chart of the EUR/USD pair with a double 50-day EMA, a 50-day EMA, and a 50-day SMA. As you can see, the double EMA, shown in green, reacts faster than the EMA and SMA.
Triple EMA
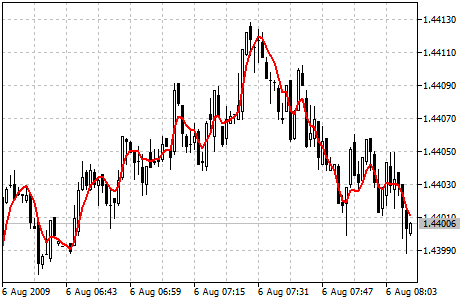
The Triple Exponential Moving Average (TEMA) reduces the lag of the traditional EMA, making it more responsive and better suited for short-term trading. Shortly after developing the Double Exponential Moving Average (DEMA) in 1994, Patrick Mulloy took the concept one step further and created the Triple Exponential Moving Average (TEMA). Like its predecessor the DEMA, the TEMA overlay uses the difference in lag between the different EMAs to adjust the traditional EMA. However, the TEMA formula uses a triple smoothed EMA in addition to the single and double smoothed EMAs used in the formula for the DEMA. The offset created using these three EMAs results in a moving average that stays closer to the price bars than the DEMA.
The calculation principle is similar to the DEMA (Double Exponential Moving Average). The name “Triple Exponential Moving Average” does not properly reflect its algorithm. It is a unique blend of single, double and triple exponential moving averages that provide less lag than each one separately.
The TEMA can be used in place of a traditional moving average. It can be used to smooth price data, as well as to smooth other indicators.
What is the 20 EMA Line?
The 20 EMA is the best moving average for daily charts because price follows it most accurately during a trend. Prices above 20 can be considered bullish and below it as bearish for the current trend. Let’s take a closer look at how you can use this moving average with your swing trades.
How to identify trends with 20 EMA
People usually point out trends when they continue for a long time, but I always ask myself how can I spot a trend early on? I don’t want to throw my money away when the trend is already so overblown and screaming for a more significant pullback. So after digging a little deeper and looking at thousands of charts, I came up with this simple rule to confirm to myself that there is a clear trend going on in a particular stock.
Setting up rules to identify trends
Let’s see how I identify trends early on. I create some rules to identify trends so I know which way a stock is going to move. You can use these rules for both uptrends and downtrends, and they also work on any time frame you want to trade. So my rules are as follows:- Price has been moving up for several days with at least one higher low (or lower low if you want to trade a downtrend).
- Price has a 20 EMA pointing up, at a two o'clock angle and steeper (or a 4 o'clock angle when you're going downtrend).
- Price has broken through resistance (or support zone in a downtrend) with very high volume.

The 20 EMA is pointing down, indicating a downtrend.
After a higher low, the stock moved up on heavy volume.
The 20 EMA is pointing up, indicating an uptrend.
As you can see, the 20 EMA is now pointing up and the stock is building a second higher low. I can tell that this stock is in an uptrend, and I can look for setups to make my plan and find my entry. If we look at the continuation of this stock price, we can see that the uptrend is continuing significantly.

How to Set Exponential Moving Average
This exponential moving average strategy consists of two elements. At the first level, it is done to capture new trends by using a double exponential moving average as an entry filter. By using a moving average with a longer period and also one with a shorter period, here are some strategies that can be done. This will eliminate all forms of subjectivity in the trading process later.
Step #1: Plot on your chart the 20 and 50 EMA
The first step is to set up our chart correctly with the right moving average. We can identify the EMA crossover in the next step. This exponential moving average strategy will use the 20 and 50 period EMA. Most of the standard trading platforms come with the moving average indicator by default. So it should not be a problem to find the EMA on either your MetaTrader4 or Tradingview platform.

Next, we will take a closer look at the pricing structure. This will bring us to the next step of the strategy.
Step #2: Wait for the EMA crossover and price to trade above the 20 and 50 EMA.
The second rule of this moving average strategy is the need for price to be able to trade further above the EMA 20 and also 50. Second, we also need to wait for the EMA crossover, which will add weight to the bullish case itself. We will refer to the EMA crossover to make a buy trade when the EMA 50 crosses above the EMA 50.

By looking at the EMA crossover, we create automatic buy and sell signals. Since the market is prone to false breakouts, we need more evidence than a simple EMA crossover. At this stage, we don’t know if the bullish sentiment is strong enough to push the price further after we buy for profit. To avoid false breakouts, we add new confluences to support our view. This brings us to the next step of the strategy.
Step #3: Wait for the zone between the 20 and 50 EMA to be tested at least twice, then look for buying opportunities.
The belief behind this strategy on moving averages can depend on many factors. After the EMA crossover occurs, we still need to be more patient. We can wait for two consecutive retests and have succeeded from the zone between the 20 EMA and also 50. Two successful retests from the zone between the 20 and 50 EMA can give the market enough time to develop a trend. Never forget that there is no price that is too high to buy in a trade. And there is no price that is too low to sell.

Note* When we refer to the “zone between the 20 and 50EMA”, we don’t actually mean that price needs to trade in the space between the two moving averages. We just want to cover the entire price spectrum between the two EMAs. This is because price will only briefly touch the shorter moving average (20-EMA). But this is still a successful retest. Now, we still need to determine where exactly we will buy. This brings us to the next step of the strategy.
Step #4: Buy in the market when we retest the zone between the 20 and 50 EMA for the third time.
If price manages to retest the zone between the 20 and 50 EMA for the third time, we go ahead and buy at the market price. We now have enough evidence that the bullish momentum is strong to continue pushing this market higher.
Now, we still need to determine where to place our protective stop loss and where to take profit. This brings us to the next step of the strategy.
Step #5: Place a protective Stop Loss 20 pips below the 50 EMA
Once the EMA crossover occurs, and after we have done two consecutive retests, we know the trend is up. As long as we are trading above both exponential moving averages, the trend is intact. In this case, we place our protective stop loss 20 pips below the 50 EMA. We add a 20 pip buffer because we understand that we don’t live in a perfect world. The market is prone to false breakouts.

The final part of our EMA strategy is the exit strategy. This is based again on the exponential moving average.
Step #6: Take Profit after we break and close below the 50 EMA
In this particular case, we did not use the same exit technique as our entry technique, which was based on an EMA crossover. If we had waited for the EMA crossover to occur on the other side, we would have given back some of the potential profit. We need to take into account the fact that the exponential moving average is a lagging indicator. The exponential moving average formula used to plot our EMA allowed us to still take profit just as the market was about to reverse.

Note** The above is an example of a BUY trade. Use the same rules – but in reverse – for a SELL trade. However, since the market is falling faster, we sell on the first retest of the zone between 20 and 50. After the EMA crossover occurs. In the image below, you can see an example of an actual SELL trade, using our strategy.

After knowing how to set the exponential moving average, invite your friends to trade forex or join GIC Affiliate and get additional income when inviting other referrals.
How to Use Exponential Moving Average
We can see that there are 3 ways exponential moving averages can be used to help you find trades, uptrends, and also exit a trade in a reliable way.#1 Trend direction and filters
Market Wizard Marty Schwartz is one of the most successful traders ever and he is also a big proponent of moving averages to identify trend direction. Here is what he had to say about them:
“The 10-day Exponential Moving Average (EMA) is my favorite indicator for determining a major trend. I have called it the “red light and green light” because it is so important in trading to stay on the right side of the moving average to give yourself the best chance of success.
When you are trading above the 10-day EMA, you have a green light, the market is in a positive mode and you should be thinking about buying. Likewise, trading below the average is called a red light. The market is in a negative mode and you should be thinking about selling.” – Marty Schwartz
Marty Schwartz uses a fast EMA to stay on the right side of the market and also filter out trades going in the wrong direction. This one tip can also make a big difference in your trading when you are about to initiate a trade with a trend in the right direction.
#2 Support and resistance and stop placement
This second thing can be helped by moving averages, namely support and resistance trading and stop placement. Because of the self-fulfilling prophecy that we discussed earlier, you will often see that the moving average is popular in working perfectly as a support and resistance level.Warning: Trend vs range
This exponential moving average will not work in a ranging market. When price is ranging back and forth between support and resistance, the moving average will usually be somewhere in the middle of the range and price will not respect it as much.#3 Bollinger Bands and the end of a trend
Bollinger Bands is a technical indicator based on moving averages. In the middle of the Bollinger Bands itself, you will find a 20-period moving average and the outer Bands will measure price volatility. During that range, prices fluctuate around the moving average, but the outer Bands are still very important.
When price touches the Outer Bands during a range, it can often signal a reversal in the opposite direction when followed by a rejection. So, even though the exponential moving average has lost its validity during a range, Bollinger Bands are a great tool that can still allow you to analyze price effectively.
During a trend, Bollinger Bands can help you stay in a trade. During a strong trend, price will usually move away from its moving average, but will move closer to the Outer Bands. When price breaks through the moving average again, it can signal a change in direction. Also, any time you see a breach of the Outer Bands during a trend, it often signals a retracement – however, it does NOT mean a reversal until the moving average is broken.
EMA Example
The initial calculation is handled in one of two ways. You can start by taking a simple average of the first fixed number ( N ) of periods and use that value to seed the EMA calculation, or you can use the first data point (usually the closing price) as the seed and then calculate the EMA from that point on. Traders handle it both ways.
This is the method used in calculating the sum of the EMAs, which shows a nine-day EMA calculation for Intel for May 2008. The EMA value for May 1 is seeded with that day’s closing price of $22.81. The EMA calculation actually starts with the closing price of May 2. For comparison, here is an SMA calculation to illustrate the difference between an EMA and an SMA.
| Date | Close | EMA | SMA |
|---|---|---|---|
| 5/1/2008 | 22.81 | 22.81 | |
| 5/2/2008 | 23.09 | 22.87 | |
| 5/5/2008 | 22.91 | 22.87 | |
| 5/6/2008 | 23.23 | 22.95 | |
| 5/7/2008 | 22.83 | 22.92 | |
| 5/8/2008 | 23.05 | 22.95 | |
| 5/9/2008 | 23.02 | 22.96 | |
| 5/12/2008 | 23.29 | 23.03 | |
| 13/5/2008 | 23.41 | 23.10 | 23.07 |
| 14/5/2008 | 23.49 | 23.18 | 23.15 |
| 15/5/2008 | 24.60 | 23.47 | 23.31 |
| 16/5/2008 | 24.63 | 23.70 | 23.51 |
| 19/05/2008 | 24.51 | 23.86 | 23.65 |
| 20/05/2008 | 23.73 | 23.83 | 23.75 |
| 21/5/2008 | 23.31 | 23.73 | 23.78 |
| 22/5/2008 | 23.53 | 23.69 | 23.83 |
| 5/23/2008 | 23.06 | 23.56 | 23.81 |
| 27/5/2008 | 23.25 | 23.50 | 23.79 |
| 28/5/2008 | 23.12 | 23.42 | 23.75 |
| 29/5/2008 | 22.80 | 23.30 | 23.55 |
| 30/5/2008 | 22.84 | 23.21 | 23.35 |
In this example, the EMA does not show the same nine-day break at the beginning of the chart as the SMA. Note that the results of the moving average calculations are also different. The EMA data is shown as a solid dark line. For comparison, the SMA data is also plotted using a lighter line.
![[Kredit: Bagan milik StockCharts.com]](https://www.dummies.com/wp-content/uploads/402000.image0.jpg)
Does Exponential Moving Average give Profit
As for stocks, here will take three companies each from the Large, Mid and Small cap groups. The decision will be taken arbitrarily. Here will use the price of BHARTIARTL to illustrate the following project.
Analysis
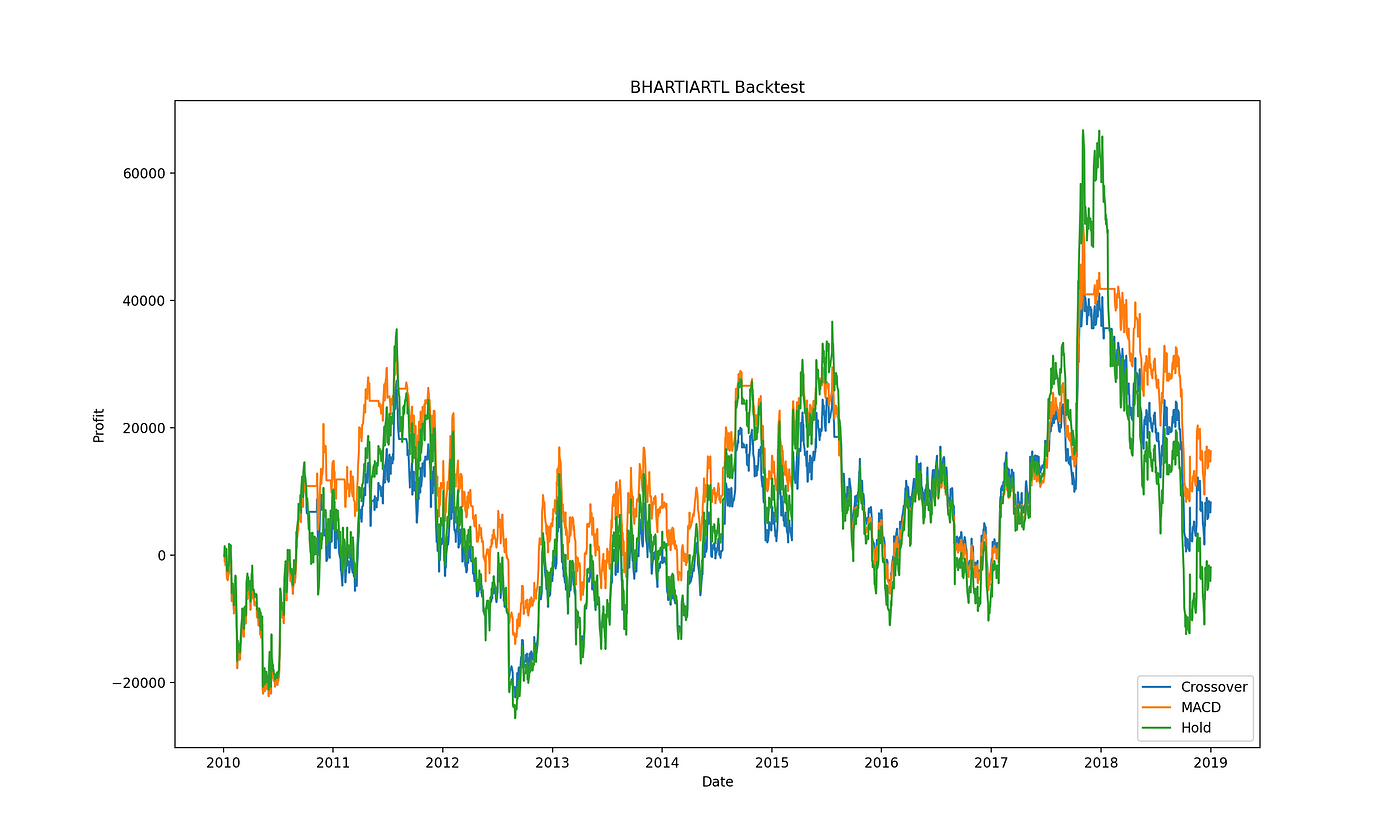
The 10-year profit-loss curve for MACD and Crossover is as follows:
Takeaways:
- MACD, due to its more responsive nature, is more active and is able to take advantage of price fluctuations to generate higher profits, while hardly incurring more losses.
- Crossovers are slower and mostly more stable
- Holding (investing the entire budget on day 1 of the backtest and not selling at all) is the least profitable strategy, especially considering the fifth point. Although, the surge in the stock price also causes the profit of holding to increase more than the others.
- Both algorithms are more profitable than not, for this stock
- The highest profit point is 50000, which is not feasible considering the large time frame. I have also taken into account that most of the profits generated can be realized and put back into stocks, which will multiply the results. So, for the following backtest, I will only take the data from 2016–19
Difference between Weighted Moving Average and exponential moving average
By using this type of Weighted Moving Average, the most recent price value that is taken into account will have a greater “weight” than the oldest value. It works in the same way as a simple moving average.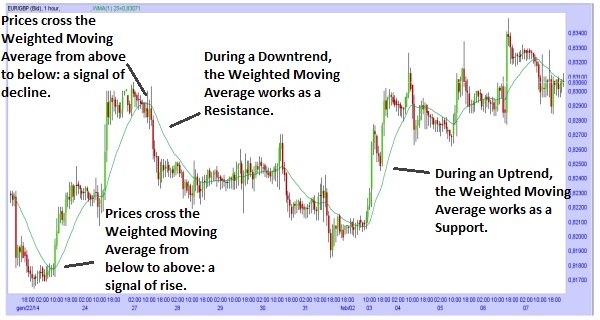
So Weighted Moving Average during Uptrend, will act as a support for Price movement; while during Downtrend, will act as resistance for Price movement. In addition, you should pay attention when Price crosses Weighted Moving Average. If Price breaks below (Goes from top to bottom) Weighted Moving Average, it is a signal of Price decline.
While if the Price breaks above (Goes from bottom to top) the Weighted Moving Average, it is a signal of a Price increase. The hardest part of using Moving Average is this one: to recognize the point where the Price crosses the Moving Average and whether this point is important or not for the Price movement. (For this reason, it is recommended to use another oscillator indicator, Candlestick Patterns of Technical Analysis, to get further confirmation of the signal obtained from the moving average).
While using this type of Exponential Moving Average, the latest price value that is calculated will have a greater "weight" than the oldest value. Exponential Moving Average (EMA) uses a more complex calculation, therefore it seems to be more accurate than other moving averages (But that doesn't mean that it is the "best" moving average to use; you should try all moving averages with different Periods, to find the one that seems to work better for you). It works the same way as a simple moving average.
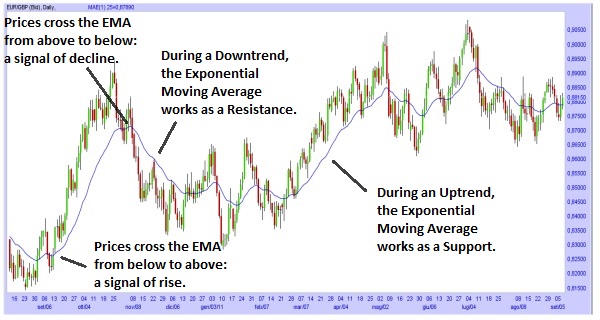
So Exponential Moving Average during Uptrend, will act as a support for Price movement; while during Downtrend, will act as resistance for Price movement. In addition, you should pay attention when Price crosses Exponential Moving Average. If Price breaks below (Goes from top to bottom) Exponential Moving Average, it is a signal of Price decline.
Meanwhile, if the Price breaks above (Goes from bottom to top) the Exponential Moving Average, it is a signal of a Price increase. The hardest part of using Moving Average is this one: to recognize the point where the Price crosses the Moving Average and whether this point is important or not for the Price movement. (For this reason, it is recommended to use other oscillator indicators, Candlestick Patterns from Technical Analysis, to get further confirmation of the signals obtained from the moving average). After knowing about this exponential moving average, then you must have learned about how to use the EMA line when trading itself. In addition, be sure to fill out the trader assessment so you can consult about the trading you are doing.
Meanwhile, if the Price breaks above (Goes from bottom to top) the Exponential Moving Average, it is a signal of a Price increase. The hardest part of using Moving Average is this one: to recognize the point where the Price crosses the Moving Average and whether this point is important or not for the Price movement. (For this reason, it is recommended to use other oscillator indicators, Candlestick Patterns from Technical Analysis, to get further confirmation of the signals obtained from the moving average). After knowing about this exponential moving average, then you must have learned about how to use the EMA line when trading itself. In addition, be sure to fill out the trader assessment so you can consult about the trading you are doing.
 Last:
Last: 


