 Last:
Last: 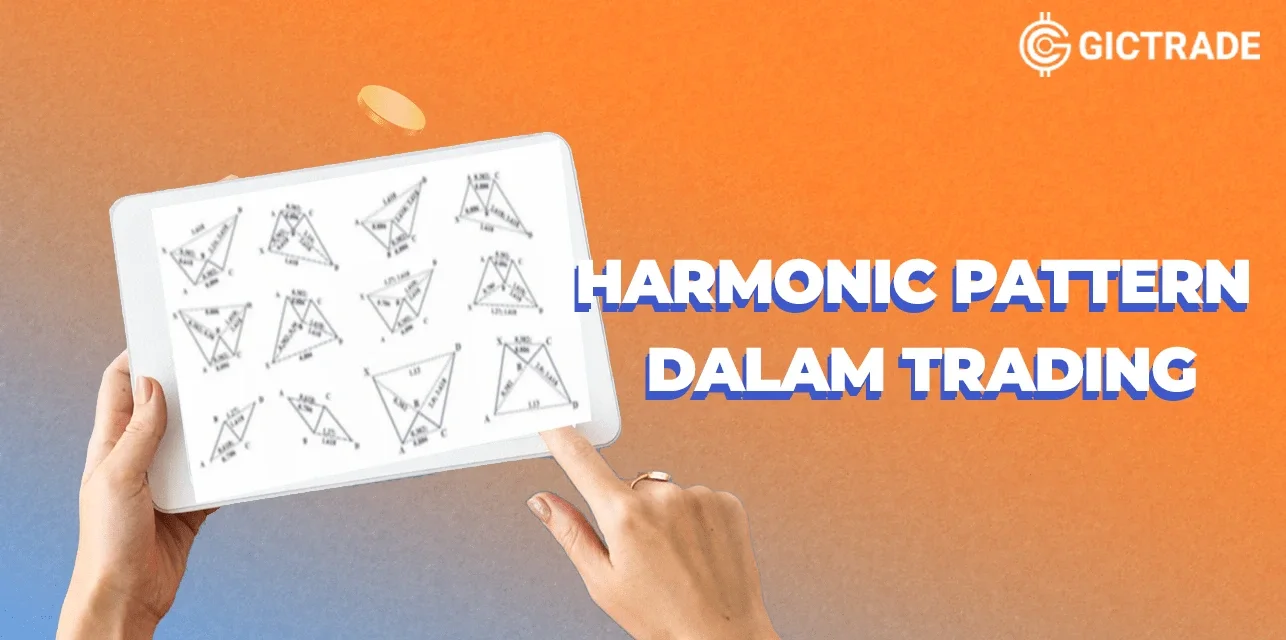
harmonic pattern indicator
Harmonic Pattern Indicator or Harmonacci Patterns are patterns used in technical analysis and are used by traders to find trend reversals. Read more about harmonic patterns below.
Getting to Know Harmonacci Patterns / Harmonic Pattern Indicator
Harmonacci patterns indicator is used in technical analysis that traders use to spot trend reversals. Using indicators such as Fibonacci extensions and retracement levels, traders can plot these harmonic patterns on a stock chart. When all the points are connected, the harmonic patterns create geometric shapes that help suggest low-risk entries and exits for trades. The main purpose of using harmonic patterns in stock trading is to predict potential price movements in the underlying stock. This is how to use these geometric shapes as a guideline to predict what the stock price will do. Harmonic patterns were first written about in 1932 in a book called Profits in the Stock Market by HM Gartley.
How to draw harmonic patterns?
Drawing these harmonic patterns is more than just connecting the dots at specific points on the chart. They take into account Fibonacci extensions and retracements, which are potential support and resistance levels. How are these numbers decided? They are taken from the Fibonacci Sequence and each Fibonacci level is associated with how much the stock has retraced from its previous high. Standard levels used include 23.6%, 38.2%, 61.8%, and 78.6%. Harmonacci patterns indicators typically have five touch points on the chart that can be connected to create a picture. Therefore ‘drawing’ a harmonic pattern is really just a matter of understanding the Fibonacci retracement levels. The type of pattern you end up drawing will likely depend on whether you are bullish or bearish on future price action. Harmonacci patterns work for both types of trading sentiment.How to trade harmonic patterns?
Below is a way to trade with the harmonic pattern indicator.Where to enter harmonic pattern trades?
Each harmonic pattern has a specific entry or exit point for a trade. This often follows a major retracement to a Fibonacci level, where the stock is preparing for its next move up or down. For most harmonic patterns, the entry point comes at Point D which is usually the last point in the pattern. A common mistake is that traders will trade as soon as this level is reached, rather than waiting for confirmation of price action.Understanding Lagging Indicators and Their Differences with Leading and Lagging
When to exit a harmonic pattern trade?
Most of your targets for harmonic pattern trades will be near the high or low of the pattern depending on the bearish or bullish nature of the pattern. For example, if you are long on a bullish Gartley Pattern, your first target would be a retracement back to the AC double-top. This correlates to the Fibonacci retracement area of around 62-79% percent. You can then hold the rest of your position for a 2x target of around 127%. A bearish trade would be no different, just a mirror image of the target zone but on the downside. We can distinguish six basic Forex harmonic patterns:- Gartley Pattern : Developed by HM Gartley, this pattern is most commonly used in the harmonic trading community. Using Fibonacci ratios, the Gartley pattern attempts to identify examples of breakouts, resistance, and support. The pattern is characterized by an uptrend, followed by a small reversal, followed by a smaller uptrend, and completed by a larger reversal (forming an asymmetrical “M” or “W” shape).
- Butterfly Pattern : There are two different types of butterfly patterns; the bearish butterfly and the bullish butterfly. Like the Gartley pattern, this pattern is designed to reveal when a trend reversal is stronger than the original trend. Using the triangle created within the butterfly, traders can determine whether holding a short or long position is most profitable.
- Crab Pattern : The crab pattern is ideal for traders who are trying to identify the right price movements. It allows traders to maximize returns on low volatility securities. The crab pattern is similar to the butterfly pattern but is more condensed. This allows for capturing smaller movements.
- Bat Pattern : Compared to other patterns, the bat pattern is still trapezoidal, but more symmetrical. For bearish and bullish patterns, the right and left sides will have almost the same height.
- Shark Pattern : The shark pattern is one of the newer harmonic trading patterns and has been used since 2011. It uses a similar five-leg reversal sequence. The steep outer lines and shallow slope in the middle create a chart that resembles a dorsal fin. That is how the shark pattern got its name.
- Cypher Pattern : The cypher pattern is an advanced trading pattern that combines Fibonacci trading with other indicators (such as the RSI). The cypher uses tighter Fibonacci ratios (usually less than 1), which creates a “steeper” visual appearance.
Benefits of Trading Using the Harmonic Pattern Indicator Strategy
There are many benefits of harmonic trading. For example, if you become an expert in one of the Forex harmonic patterns, you will know how to trade it on a particular pair. You will be able to know when is the best time to trade and when the market will react in a certain way. You will become an expert in Forex harmonic patterns. A useful tool for trading this strategy is a harmonic pattern scanner or dashboard that shows all the patterns on different instruments. However, we recommend that you study the patterns well before using the scanner or dashboard. Our favorite time frames for the Amazing harmonic patterns indicator trading strategy are the 1 hour, 4 hour or Daily charts. For simplicity, we will refer to the Amazing harmonic patterns trading strategy as the AHPT trading strategy. We do not want to go to lower time frames because, after extensive backtesting, we found that the Amazing harmonic patterns trading strategy works best on higher time frames.Implement Harmonic Pattern Indicator
As a trader, knowing various pattern strategies is very important. Various patterns can help you analyze trends. But how do you implement these strategies when trading? You can start trading with the GICTrade platform, a P2P platform that will help you trade easily with low and reliable transaction costs. Download the GICTrade Mobile Apps only on the Google Play Store and Apple App Store and don't forget to register to start trading with GICTrade.


