 Last:
Last: 
Definition of Fundamental Analysis
Fundamental Analysis refers to a detailed examination of the basic factors that affect the interests of an economy, industry and company. It is intended to measure the true intrinsic value of a stock, by measuring economic, financial and other factors (both qualitative and quantitative) to identify opportunities where the value of the stock will vary from its current market price. Fundamental analysis assesses all factors that have the ability to affect the value of a security (including macroeconomic factors and organization-specific factors), called fundamentals, which are none other than financial statements, management, competition, business concepts, etc. It aims to analyze the economy as a whole, the industry in which it is located, the business environment and the company itself.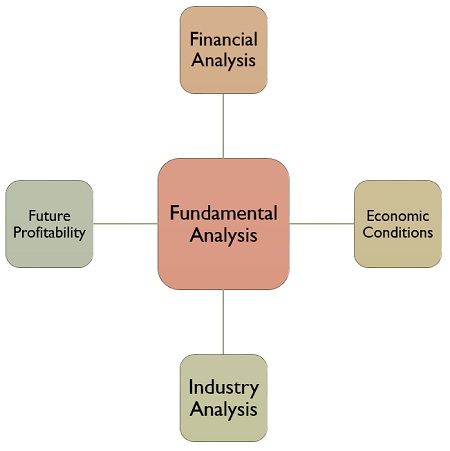
It relies on an assumption that there is some kind of delay in influencing the price of the stock by these fundamentals. So, in the short term, the stock price does not match its value, but in the long term it adjusts itself. Here is a three-phase fundamental analysis of the factors:
- Economy : To be able to analyze the general economic status of a country's condition. This can be analyzed through an economic indicator.
- Industry : To determine a prospect in various industrial classifications, with the help of various competitive analysis between industries and also analysis of the industry life cycle.
- Company : To find out the financial and non-financial characteristics of a company to be able to know whether to buy, sell or hold the company's shares. For this purpose, sales, EPS, profitability, will be analyzed together with management, company image, and also product quality.
Definition of Technical Analysis
This Technical Analysis is used to be able to predict a stock price, which says that the stock price of the company is based on an interaction of the forces between demand and supply, which operate in the market. This is used to be able to predict a stock market price in the future, according to past performance statistics of the stock itself. For that, make sure first about the change in stock price, to be able to know how the price will change in the future. The price at which buyers and sellers of shares, who decide to complete a deal, is one of the values that combines, weighs and expresses all factors, and is the only value that is very important. In other words, this technical analysis will give you a clear and comprehensive view of the reasons for the change in the price of the security.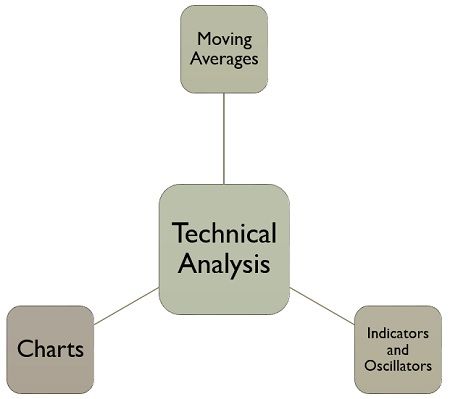
This has been based on a premise that stock prices move in a trend, that is, up or down, depending on the attitude, psychology and emotions of traders.
Tools Used for Technical Analysis
- Price : Perubahan harga dari sekuritas direpresentasikan dalam suatu perubahan sikap investor dan permintaan serta penawaran sekuritas.
- Time : The degree of price movement is a function of time, namely the time required for a trend reversal that will determine the price change.
- Volume : The magnitude of a price change can be seen from the transaction volume which is also a characteristic of the change. For example, there is a change in the stock price, but there is also a small change in the volume of transactions, then it can be said that the change is not too strong and influential.
- Lebar : The quality of price changes, measured by determining whether the change in trend is spread across many industries or is specific to a few securities. It also reflects the extent to which the price changes of the security have occurred in the market in line with the overall trend.
Fundamental vs Technical According to Experts
Fundamental analysis involves using economic data (e.g., production, consumption, disposable income) to forecast prices, while technical analysis is primarily (and often solely) based on the study of patterns in the price data itself. So which method is better? This question is the subject of the second part of the article. Interestingly, experts are no less divided on this issue than beginners. In a series of books in which the Authors of “The Complete Guides of Futures Market - Jack D. Schawger and Mark Etzkon Publication Year 2017 Edition Two” have interviewed some of the world’s best traders, one was struck by the very different views on this debate.Jim Rogers is a trader who is characteristic of one of the Extreme Spectrum. During the 1970s, Jim Rogers and George Soros were the two principals of the Quantum Fund, perhaps the most successful Wall Street fund of its time. In 1980, Rogers left the fund to avoid managerial responsibilities and devoted his time to managing his own investments—an endeavor that he once again proved spectacularly successful. (The Quantum Fund, published in 1969, is “essentially the precursor to the multi-investment hedge fund,” which has maintained its excellent performance in subsequent years under the leadership of George Soros.)
Over the years, Rogers has been on the record for a high percentage of absolute market price predictions. As one example, in a 1988 interview with Jack D. Schawger, Rogers correctly predicted the massive collapse of the Japanese stock market and the continued downward trend in gold prices for years. Jim Rogers is certainly a man whose opinions (speculative analysis) deserve special attention.
When Jim D. Schawger asked Rogers about his opinion on chart reading (the old method of predicting market prices using Technical Analysis), he replied: "I have never met a rich technical analyst. Not including, of course, the technical analysts who sell their services and make a lot of money." That cynical response succinctly summarizes Rogers' view of technical analysis.
In this one view, Rogers certainly disagrees that the use of Technical Analysis in predicting market prices is only based on historical data that already exists, which of course this analysis basis cannot be used as a reference for making decisions in the financial market or the stock market. Marty Schwartz is a trader whose views lie at the other extreme. At the time of the Jack D. Schwager interview, Schwartz, an independent stock index futures trader, was considering outsourcing his money.
In connection with this venture, he had just audited his personal track record, and he allowed Jack D. Schwager to see the results. Over the previous 10-year period, he had averaged a 25 percent gain—every month! Equally impressive, over this 120-month period, he had only seen two losing months—meaning minuscule losses of 2 percent and 3 percent. Again, this was an individual whose opinions about the market commanded serious respect.
Although Jack D. Schwager himself did not mention Rogers’ comments to Schwartz, when he asked Schwartz if he had made a switch from fundamental analysis to technical analysis (Schwartz had begun his financial career as a stock analyst), his response came across as almost a direct rebuttal to Jim Rogers: “Absolutely. I always laugh at people who say, ‘I’ve never met a rich technical analyst.’
So I like that idea! What an arrogant and unreasonable answer. I have been using the basics of technical analysis for nine years and have become rich as a person who uses and does technical analysis. "There you will be dealing directly when the trading market is open both on the stock market and the foreign exchange market (forex).
Which is Better, Fundamental vs Technical?
Two incredibly successful market players hold opposing views on the probability of which is more profitable with the use of fundamental analysis vs. technical analysis. So in this article Who do you believe? A Fundamental Analysis or Technical Analysis? In Jack D. Schwager's own judgment, there is an element of truth in both Rogers and Schwartz's views.
It is possible to succeed as a trader by being either a pure fundamentalist, a pure technical analyst, or a combination of the two. The two methods are certainly inseparable in the world of investment markets, be it the stock market or forex. In fact, many of the world's most successful traders use fundamental analysis to determine the direction of market trading and a technical analyst can be used as a reference to determine the entry and exit times of trading positions that have been taken.
One universal trait I have found among successful traders is that they gravitate towards the approach that best suits their personality. Some traders prefer a long-term approach, while others. The Great Fundamental vs. Technical Analysis Debate tends towards day trading; some traders are comfortable only when following signals generated by automated systems, while others find such mechanical methods anathema; Some traders thrive in the almost frenetic atmosphere of a trading room, while others succeed only when their decisions are made in the quiet of an office; and some traders find fundamental analysis a natural approach, while others instinctively lean towards technical methods, and still others are a mix of the two.
Basically, there is no universal answer to the question of which is better, fundamental analysis or technical analysis? Simply put, each analysis carried out depends on the individual using it, and must determine a natural approach. Before learning about the popularity of fundamental vs technical, it is a good idea to invite your friends to trade or become an IB Affiliate so that you can get additional income to trade with GIC.
Fundamental vs Technical Popularity
The relative popularity of fundamental versus technical analysis tends to wax and wane in a broadly cyclical fashion. In the 1970s, fundamental analysis was considered a solid approach, while technical analysis was considered by many to be hocus-pocus or black magic. The situation changed, however, as the major price trends that developed during the commodity inflationary period of the 1970s were ideally suited to trend-following techniques and were widely favored by technical analysts.
Even the simplest trend-following strategies tended to perform very well during these periods. Meanwhile, sophisticated fundamental methodologies often proved to be very misleading to market participants. In this environment, the popularity of technical analysis grew rapidly, while the popularity of fundamental analysis declined.
This basic trend continued into the 1980s, as technical analysis became the method of choice and fundamental analysis the minority method. By the late 1980s, most money managers in the futures industry (known as commodity trading advisors, or CTAs) were using technical analysis exclusively or for at least the majority of their trading decisions.
So, while in the early 1970s, few market participants would even consider technical analysis, by the late 1980s, few would consider fundamental analysis due to its popularity. However, today, market behavior has become increasingly erratic, with sustained trends becoming fewer and the percentage of false breakouts (i.e., price moves above or below a trading range that are followed by a reversal rather than an extension) has increased.
Simultaneously, the performance of some of these technical trend followers has deteriorated substantially, or at least their results have shown periodic deep equity retracements. At the same time, it turns out that many of the best performing traders and money managers are those who have primarily focused on fundamental analysis, or at least have relied on fundamental analysis as a significant input into their trading decisions.
Tools for Fundamental and Technical Analysis
Fundamental analysis is used to consider the financial position and performance of a company, the market in which it operates, its competitors and the economy. The most important source of data for fundamental analysis is the company’s financial statements. These include the income statement, balance sheet and cash flow statement. Data from these statements can be used to calculate ratios and metrics that reflect the performance, health and growth of a company.
Industry data and economic factors such as interest rates and retail spending are also used to estimate future growth rates. Ultimately, fair value is derived by comparing models and ratios. Technical analysis is much more extensive than most people realize. All chartists will use a price chart – usually a line chart, bar chart or candlestick chart.
In addition to the price chart, the tools used can also vary greatly. Some analysts have used an indicator such as a moving average and also an oscillator that can be calculated from the price of the stock owned. Other tools usually use price patterns, and also complex analysis frameworks such as Elliott Waves and Market Profiles. Trend followers usually use other tools to be able to identify price trends and also measure momentum.
When Should You Use Fundamental and Technical Analysis?
Fundamental and technical analysis suit different groups of investors. On the one hand, fundamental analysis is suitable for individuals who have a long-term investment perspective. On the other hand, technical analysis is suitable for short-term traders.Long Term Investment
Compared to short-term trading, long-term investing requires a more in-depth analytical approach. Thus, by analyzing various micro and macro factors, one can estimate the intrinsic value of a stock. Therefore, in this method, investors can learn which stocks will provide the best long-term returns based on their fundamental value.Short Term Trading
Technical analysis helps in identifying the short-term earning potential of a stock. Therefore, stock price predictions are based on historical data and will only be valid for the short term. As a result, they cannot be used to make long-term purchases. Before learning when to use fundamental vs technical analysis when done together, don't forget to also conduct an internal survey so that GIC can be even better.Using Fundamental and Technical Analysis Together
When looking at future supply and demand, technical analysis and fundamental analysis are often combined to give traders a bigger picture of the market. There are many traders who will build a pricing model and then look at the charts to confirm their assumptions or adjust their entries and exits. There are also many traders who review the charts and then look at the fundamentals to see if future supply and demand are enough to potentially move price through support or resistance or create a supply or demand situation that will cause price to potentially trend for an extended period of time. There are some market shocks that have supply and demand effects that can last for months or years.
In short, there is no “right” side to the debate between fundamental versus technical analysis: the right approach will depend on the individual using it. Furthermore, even for individual traders, the perceived answer can change dramatically, or even completely reverse, over a period of years. Also, combining fundamental and technical analysis can provide a very effective approach and is indeed descriptive of the general methodology used by some of the world’s most successful traders. The bottom line is that each trader should explore both analytical approaches and choose the methodology or combination that feels most comfortable and suits their needs. After learning about fundamental vs technical, download the GICTrade application on the Play Store or App Store to continue participating in the GIC Trading Competition which has a total prize of 3 Billion Rupiah!Examples of Using Fundamental and Technical Analysis
Markets are interconnected, often a trader needs to look at more than one market to build a complete picture of what they are trading. Fundamental analysts will model the relationship between two markets and try to understand how supply and demand in one market can affect supply and demand in the other. An example of this is the cost of cattle feed and the cost of cattle. If feed costs increase, then the cost per head of cattle will also increase.
If feed costs are too high then farmers may liquidate cattle in the short term, depressing prices and creating a situation where future supply is reduced and future cattle prices are increased. These relationships can be complex and sometimes difficult to model easily, a trader needs to be aware that there are many factors that can move the markets they are trading.
A technical analyst is interested in the correlation between two markets. A technical analyst will plot the two commodities they are interested in analyzing on a single chart and look for correlations between the two products. They will look to see if the prices of both markets are moving up and down at the same time or if the price in one market is moving up when the price in the related market is moving down. The cart can also indicate that there is no relationship between the two markets.As with any trading strategy or analysis, each trader will look at the data in a slightly different way and incorporate their own set of rules to make decisions.


